- The Dogs of Dow strategy has generally beaten the market and achieved better results throughout history.
- Simplicity and ease of execution make it attractive to investors.
- Let's take a look at some of the stocks that are a part of this strategy.
- Looking to beat the market in 2024? Let our AI-powered ProPicks do the leg work for you, and never miss another bull market again. Learn More »
The Dogs of Dow strategy, created by Michael O'Higgins and detailed in his book "Beating the Dow," was initially conceived for companies listed on the Dow Jones Industrial Average.
However, it's applicable beyond North America, extending to European stock market indexes.
The methodology involves selecting the 10 companies with the highest dividend yield at the close of the last trading session of the year.
Once identified, an equal number of shares from each of these 10 companies are purchased and held throughout the entire year.
From 1957 to 2003, spanning 46 years, this strategy demonstrated an average annual return of +14%, surpassing the Dow Jones' average annual return of +11% during the same period.
In more recent times, from 2010 to 2017, the strategy consistently outperformed the Dow Jones.
For the year 2024, the stocks constituting the Dogs of Dow strategy, along with their respective dividend yields, are as follows: [List of stocks and dividend yields].
- Walgreens Boots Alliance(NASDAQ:WBA): 7.35%
- Verizon Communications (NYSE:VZ): 7.06%
- 3M Company (NYSE:MMM) 5.49%
- Dow (NYSE:DOW) 5.11%
- IBM (NYSE:IBM) 4.06%
- Chevron (NYSE:CVX) 4.05%
- Coca-Cola (NYSE:KO) 3.12%
- Amgen (NASDAQ:AMGN) 3.12%
- Cisco Systems (NASDAQ:CSCO) 3.09%
- Johnson & Johnson (NYSE:JNJ) 3.04%
Also interesting is the ALPS Sector Dividend Dogs ETF (NYSE:SDOG), which equally weights the five stocks in each of the 11 S&P 500 sectors with the highest dividend yields. It's sort of like a modified Dogs of the Dow.
Let's take a look at some of them using the InvestingPro professional tool to get some interesting data.
1. Walgreens Boots Alliance
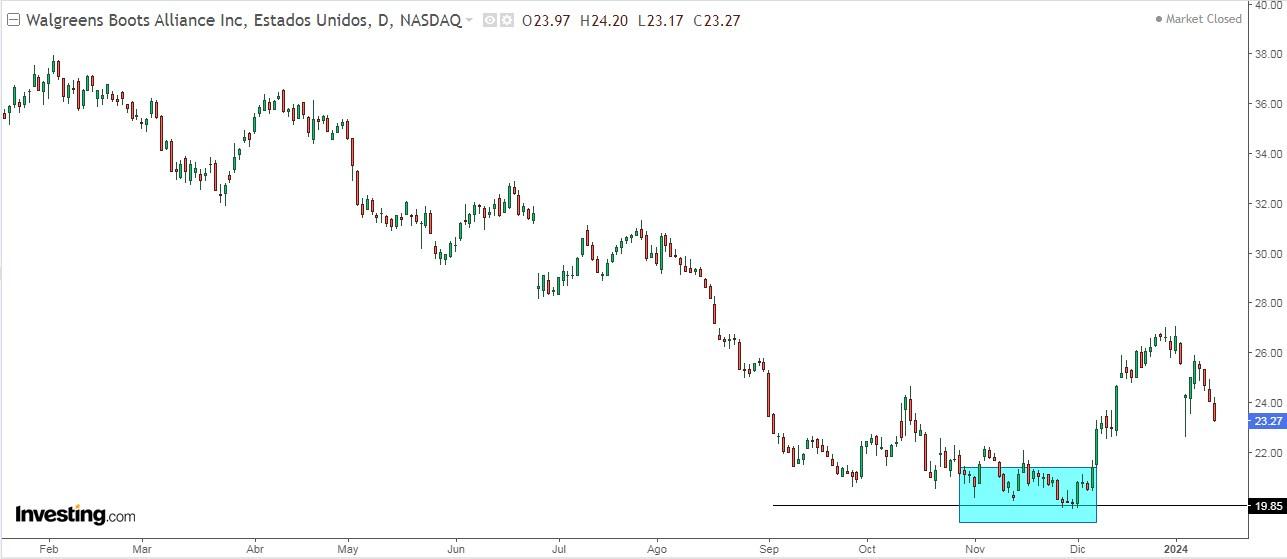
Walgreens is a pharmaceutical company that was founded in 1909 and is headquartered in Deerfield, Illinois.
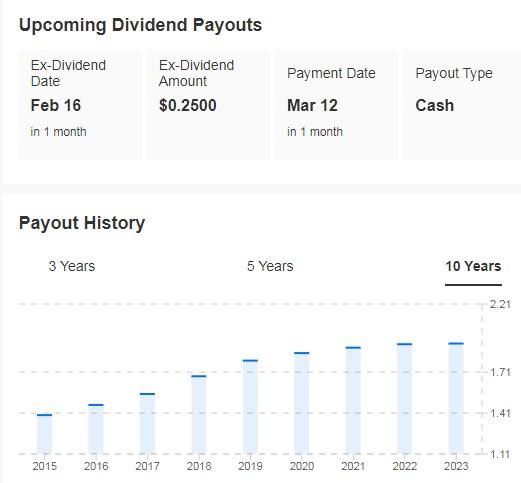
On March 12, it pays a dividend of $0.25 per share, and to receive it you must own shares before February 16. The dividend yield is +4.30%.
Source: InvestingPro
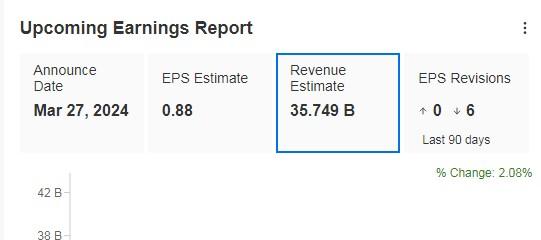
On March 27 it presents results and is expected to increase revenues by +2.08% and by 2024 by +3.5%.
Source: InvestingPro
CEO Timothy Wentworth disclosed the purchase of 10,000 shares made on January 5 at an average price of $24.222 per share and already owns a total of 585,122 shares following the latest acquisition.

Source: InvestingPro
The market sees potential for it at $26.18.

Source: InvestingPro
2. Verizon Communications
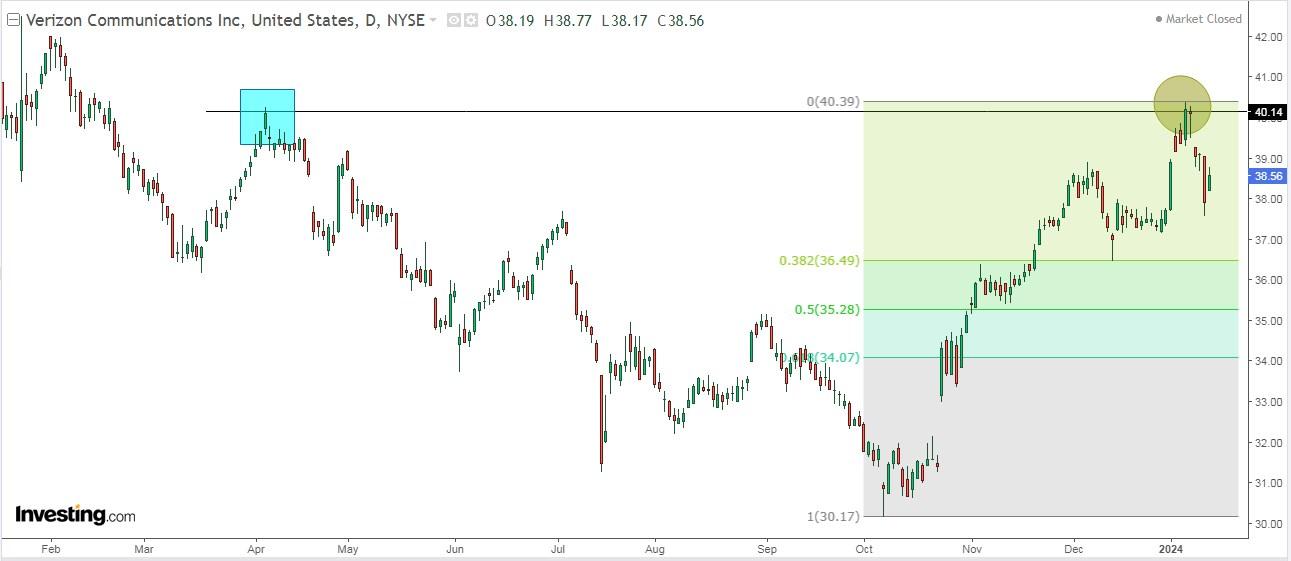
Verizon Provides communications, technology, information and entertainment products and services to consumers, businesses and government entities worldwide.
The company was formerly known as Bell Atlantic Corporation and changed its name to Verizon Communications in June 2000. It was founded in 1983 and is headquartered in New York.
Its dividend yield is +6.90%.
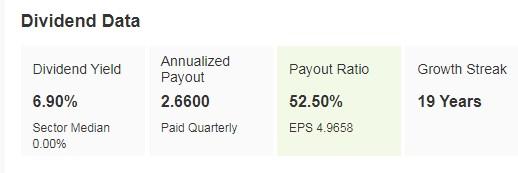
Source: InvestingPro
On January 23 it is due to release its accounts and for 2024 it expects revenue growth of +1.5%.

Source: InvestingPro
The market sees potential at $41.97, while InvestingPro models see it at $45.84.

Source: InvestingPro
3. 3M Company
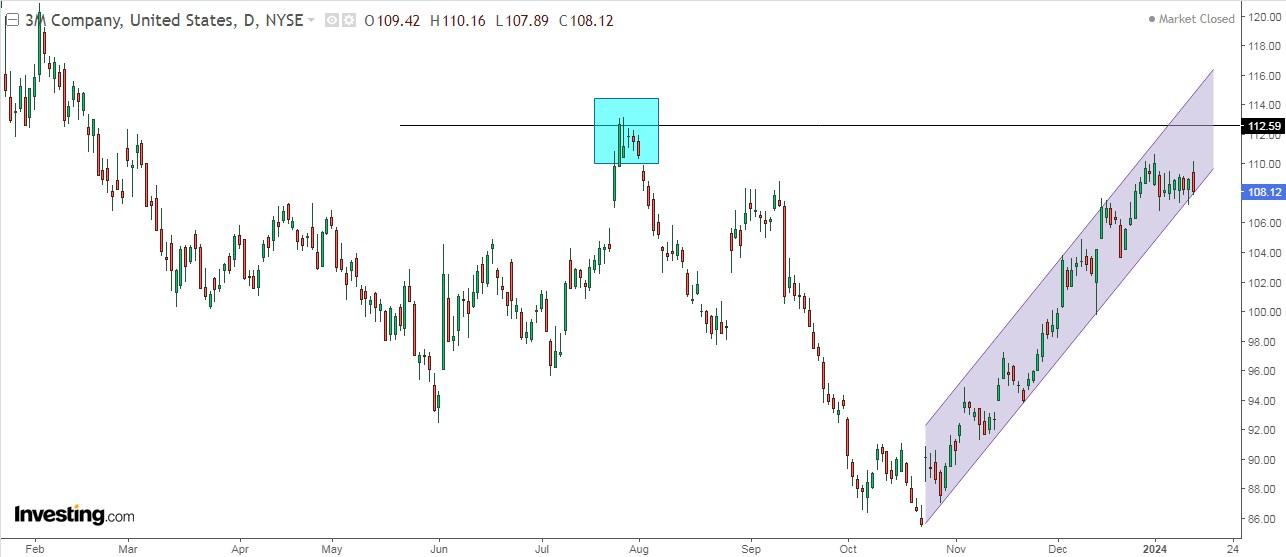
3M is dedicated to researching, developing and commercializing diversified technologies, offering products and services in various areas such as industrial equipment. It was founded in 1902 and is headquartered in St. Paul, Minnesota.
Its dividend yield is +5.55%.
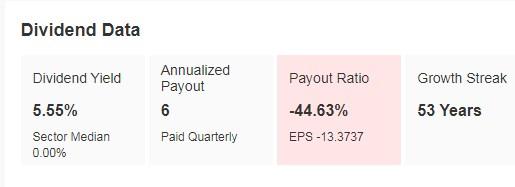
Source: InvestingPro
We will know its numbers on January 23 and it is expected to have a 2024 EPS increase of 7.7% and revenue of +3%.
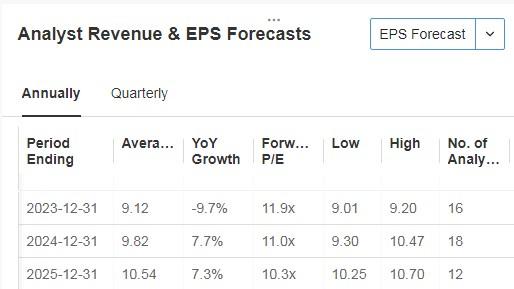
Source: InvestingPro
The market sees potential at $114.26 and InvestingPro models at $134.69.

Source: InvestingPro
4. Johnson & Johnson
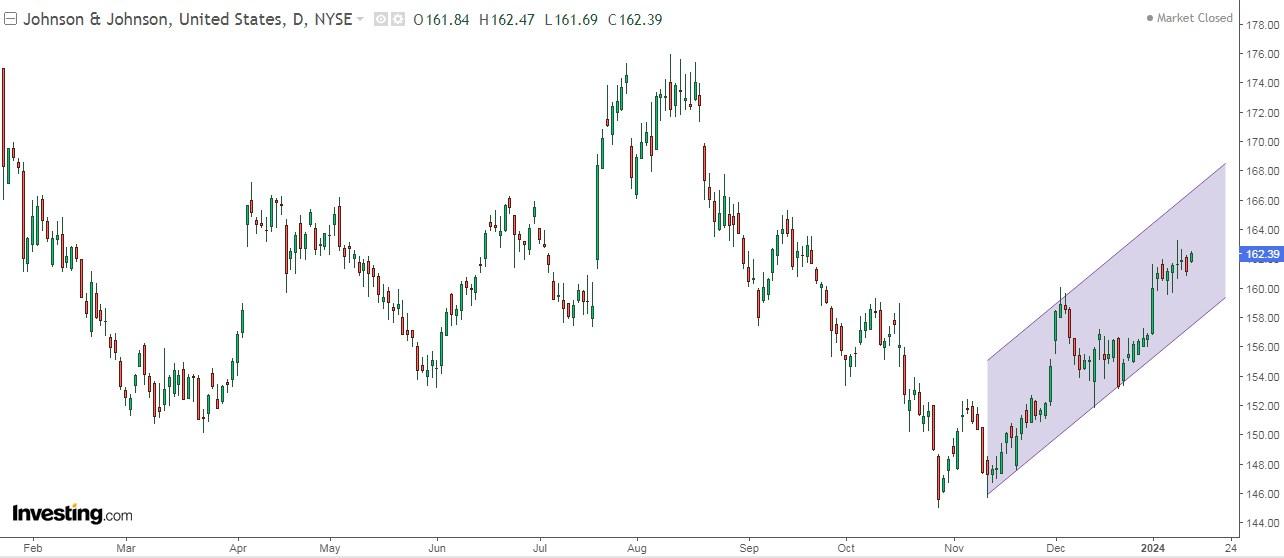
Johnson and Johnson Researches, develops, manufactures and sells various baby care products. It was founded in 1886 and is headquartered in New Brunswick, New Jersey.
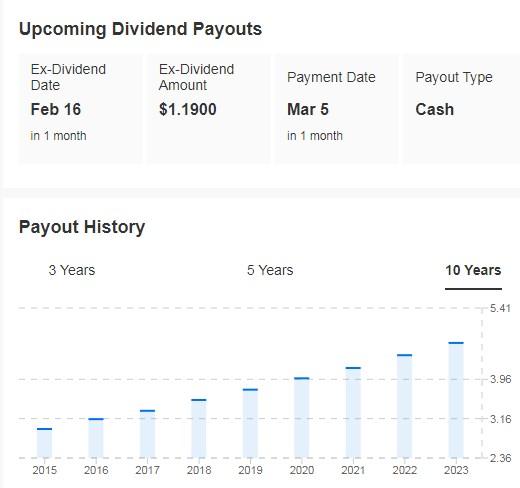
It pays a dividend of $1.19 per share on March 5, and you must own shares by February 16 to receive it. The dividend yield is +2.93%.
Source: InvestingPro
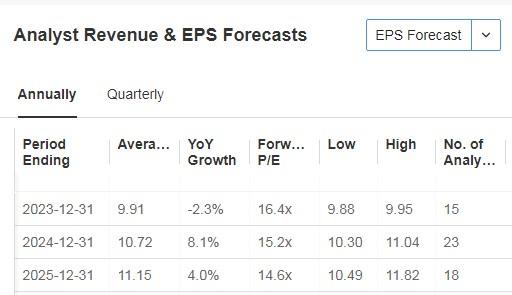
It will present its accounts on January 23 and for 2024 it expects an increase in earnings per share (EPS) of +8.1% and revenue of +3.1%.
Source: InvestingPro
The estimated projection on Wall Street for its shares would be around $174.68.

Source: InvestingPro
5. Cisco Systems
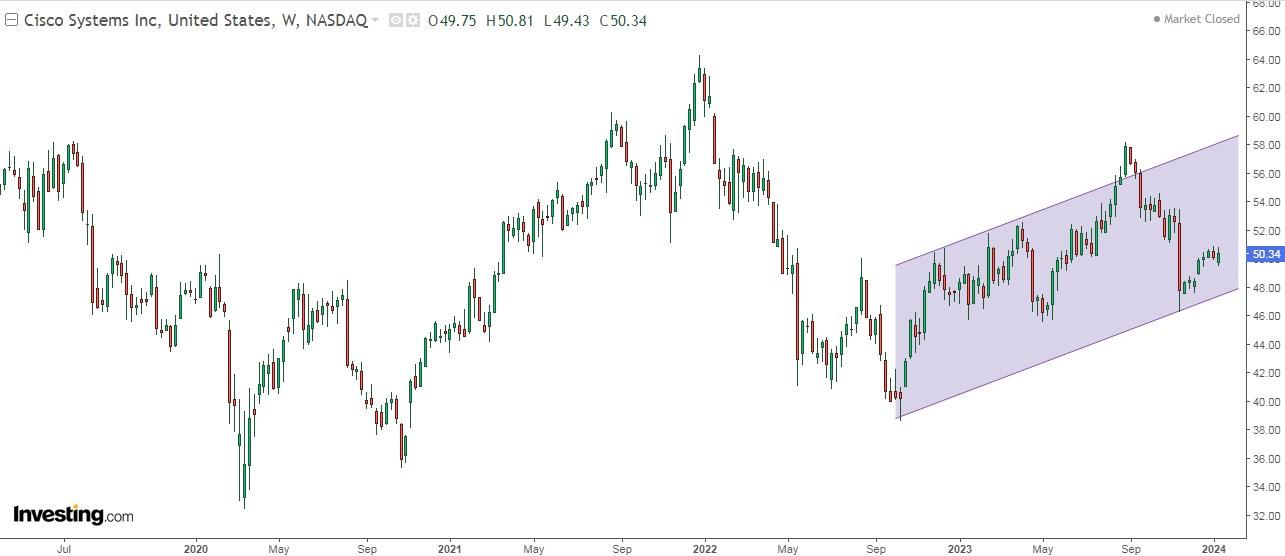
Cisco designs, manufactures and sells products related to the information and communications technology industry. It was incorporated in 1984 and is headquartered in San Jose, California.
Its dividend yield is +3.10%.

Source: InvestingPro
It presents its accounts on February 14.
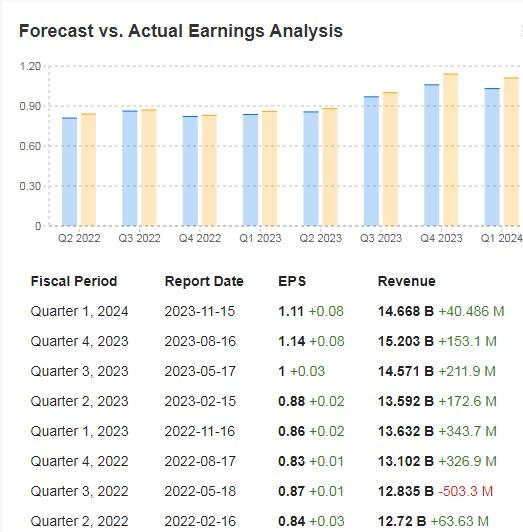
Source: InvestingPro
It has 28 ratings, of which 9 are buy, 18 are hold and 1 is sell.
The market estimate is to see it at $53.97, while InvestingPro models see it at $56.77.

Source: InvestingPro
***
In 2024, let hard decisions become easy with our AI-powered stock-picking tool.
Have you ever found yourself faced with the question: which stock should I buy next?
Luckily, this feeling is long gone for ProPicks users. Using state-of-the-art AI technology, ProPicks provides six market-beating stock-picking strategies, including the flagship "Tech Titans," which outperformed the market by 670% over the last decade.
Disclaimer: This article is written for informational purposes only; it does not constitute a solicitation, offer, advice, or recommendation to invest as such it is not intended to incentivize the purchase of assets in any way. I would like to remind you that any type of asset, is evaluated from multiple points of view and is highly risky and therefore, any investment decision and the associated risk remains with the investor.

