NVDA Q3 Earnings Alert: Why our AI stock picker is still holding Nvidia stockRead More

4 Ways To Trade Goldman Sachs

Published 02/21/2017, 11:15 AM
Updated 05/14/2017, 06:45 AM
GS
-

Goldman Sachs (NYSE:GS) is on the verge of a major breakout. The stock hit a high near 251 in 2007 before dropping precipitously during the financial crisis to a low under 50, a drop of over 80%. Since then, it had a strong rise through 2009 and then a 3-year pause before moving back higher in 2013. A 3-year bull market found a top in mid 2015 and pulled back again. This time it reset 36% lower with a double bottom in 2016 as shown in the chart below. This has not been a straight-up 8-year bull run for Goldman Sachs.

New Movement

The stock confirmed that double bottom at the end of October and then raced higher in November after the election. It stopped just short of the 2007 high in December and consolidated for over 2 months. Last week saw new movement in the stock, pushing up out of the consolidation zone and to the 2007 high. As it does so, it establishes a target to 317 with a natural spot for a stop loss near 230. Momentum is a bit hot but that is a good thing on the weekly chart.

Digging into the weeds a bit, the stop does go ex-dividend next week on the 28 and then looks to earnings on April 18. This will be well after the March 15 FOMC meeting, which could be a bigger catalyst. Short interest is very low at just over 1%.

The options chain shows little bias for any movement this week. The March options have their biggest open interest below at the 240 strike though. The April options chain suggests a net pullback but it has much more open interest above on the call side at 260 and 270 and then even 300.
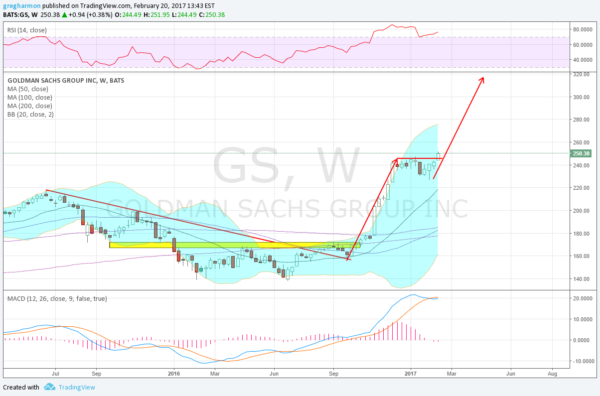
Goldman Sachs Group

Four Trades

  • Trade Idea 1: Buy the stock now (over 246) with a stop at 230.
  • Trade Idea 2: Buy the stock now (over 246) and add an April 250/230 Put Spread ($6.40) while selling a July 270 Covered Call ($6.50 credit).
  • Trade Idea 3: Buy the April 255 Calls ($6.80).
  • Trade Idea 4: Buy the April 230/255 bullish Risk Reversal ($4.25).

Latest comments

Loading next article…
Risk Disclosure: Trading in financial instruments and/or cryptocurrencies involves high risks including the risk of losing some, or all, of your investment amount, and may not be suitable for all investors. Prices of cryptocurrencies are extremely volatile and may be affected by external factors such as financial, regulatory or political events. Trading on margin increases the financial risks.
Before deciding to trade in financial instrument or cryptocurrencies you should be fully informed of the risks and costs associated with trading the financial markets, carefully consider your investment objectives, level of experience, and risk appetite, and seek professional advice where needed.
Fusion Media would like to remind you that the data contained in this website is not necessarily real-time nor accurate. The data and prices on the website are not necessarily provided by any market or exchange, but may be provided by market makers, and so prices may not be accurate and may differ from the actual price at any given market, meaning prices are indicative and not appropriate for trading purposes. Fusion Media and any provider of the data contained in this website will not accept liability for any loss or damage as a result of your trading, or your reliance on the information contained within this website.
It is prohibited to use, store, reproduce, display, modify, transmit or distribute the data contained in this website without the explicit prior written permission of Fusion Media and/or the data provider. All intellectual property rights are reserved by the providers and/or the exchange providing the data contained in this website.
Fusion Media may be compensated by the advertisers that appear on the website, based on your interaction with the advertisements or advertisers.
© 2007-2024 - Fusion Media Limited. All Rights Reserved.