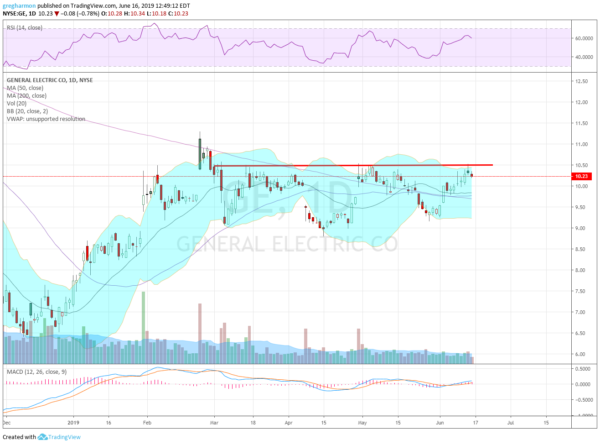
General Electric (NYSE:GE), GE, rose off of a December low following a multi-year decline. The rise ended as it hit the 200 day SMA in February. Since then it has moved sideways under horizontal resistance. Coming into the week it is at the top of the resistance zone and over the 200 day SMA. It has a RSI just into the bullish zone with the MACD rising and positive. The Bollinger Bands® are flat.
There is resistance at 10.50 and a move over that triggers a target to 13.75. Above 10.50 resistance is at 10.90 and 11.15 then 11.55 and 12.30 before 13.25 then 13.70 and 15. Support lower comes at 10 and 9.50 then 9. Short interest is low at 1.2%. The stock pays a dividend that yield just 0.39% and it started trading ex-dividend last March 8th. The company is expected to report earnings next on the morning of July 18th.
The June options chain shows the largest open interest at the 10 and 9 strike puts. It is also very large at the 10 and 11 strike calls. July options, covering the earnings report, have the largest open interest at 11 strike call then the 10 calls. The 10 puts are not far behind that. In August the open interest is biggest at the 11 and 12 strike calls, then the 8 puts.
General Electric, Ticker: $GE

4 Trade Ideas For General Electric
- Buy the stock on a move over 10.50 with a stop at 10.
- Buy the stock on a move over 10.50 and add a July 10/9 Put Spread (27 cents) while selling the August 12 Call (13 cents).
- Buy the July 5 Expiry/July 11 Call Calendar (10 cents).
- Buy the August 9/11 bullish Risk Reversal (15 cents).
