Defying concerns about supply in the market, the residential real estate market is back with a bang driven by robust demand levels. Per a study by the real estate technology and analytics firm, RealPage, Inc. (NASDAQ:RP) , the second-quarter demand level of 175,645 apartments across the nation marked one-third increase from the level witnessed a year ago.
This helped occupancy to remain high at 95.0% as of mid-year and led to stabilization in the annual pace of rent growth, which came in at 3.6%, close to 3.7% growth experienced in the first quarter. Notably, job formation and checked move-outs for buying homes acted as the catalyst.
But not all residential REITs are equally poised to gain, as location of properties play a crucial role in determining the demand of properties.
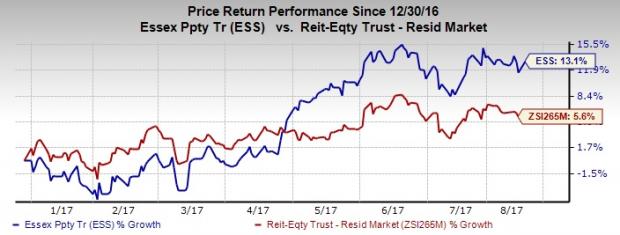
However, one such residential REIT stock which has been displaying strength is Essex Property Trust, Inc. (NYSE:ESS) . This Zacks Rank #2 (Buy) stock has gained 13.1% year to date, outperforming the 5.6% increase of the industry it belongs to. Furthermore, funds from operations (“FFO”) per share estimates for third-quarter and full-year 2017 moved north over the past seven days.
This San Mateo, CA-based residential REIT is likely to well leverage on favorable demographic trends in its markets. In fact, demographic growth continues to be strong in the young-adult age cohort, which has a higher propensity to rent. This age cohort also experiences a considerable part of the net job growth and provides a significant source of pent-up demand.
Moreover, despite the supply issue plaguing the market earlier, the company continues to display robust fundamentals and improving prospects. The company reported core FFO per share of $2.97 for second-quarter 2017, beating the Zacks Consensus Estimate of $2.92. Core FFO per share also improved 8.4% from the year-ago quarter figure of $2.74. Results reflect solid growth in revenues.
The company has also raised its outlook for full-year 2017. It projects core FFO per share in the range of $11.70–$11.96 from $11.56–$11.96 guided earlier, marking an increase of 7 cents at the mid-point.
Further, the company revised estimates for same-property gross revenue growth to 3.2–4.0% from the prior range of 3.0–4.0%, indicating an uptick of 10 bps at the mid-point. Same-property net operating income (NOI) is now guided in the band of 3.3–4.6% from the previous range of 2.8–4.6%, marking a 30 bps expansion to the mid-point. Further, Essex has a 23-year history of increasing cash dividend.
Why a Solid Choice?
Same Property NOI Growth: Essex Property has been experiencing solid growth in same property NOI. In fact, per a presentation by the company, since 2012 through 2016, its same property NOI witnessed a compound annual growth rate (CAGR) of 8.9%, well ahead of 5.5% growth recorded by the peer average. This trend is likely to continue in 2017 as well, with the company raising the NOI expectation for the present year.
FFO Per Share Growth: Essex Property delivered an earnings surprise of 1.71% in the last reported quarter. In three of the trailing four quarters, the company delivered a positive surprise, with an average beat of 1.23%.
Its historical FFO per share growth (3–5 years) of 7.34% comes above the industry average of 4.05%. This momentum is anticipated to continue in the near term as indicated by the projected FFO per share growth (F1/F0) of 7.39% for the company compared to the industry average rate of 3.71%. This, in turn, highlights Essex Property’s bright prospects.
Superior ROE: Essex Property’s Return on Equity (ROE) is 11.5% compared with the industry’s average of 10.5%. This reflects that the company reinvests more efficiently compared to the industry.
Strong Leverage: The debt-to-equity ratio for Essex Property is 0.88 compared with the industry average of 0.95. This mirrors the financial stability of the company and lesser risk for shareholders.
Other Key Picks
Other similarly-ranked stocks in the Residential REIT industry are Equity LifeStyle Properties, Inc. (NYSE:ELS) and Independence Realty Trust, Inc. (NYSE:IRT) . You can see the complete list of today’s Zacks #1 Rank (Strong Buy) stocks here.
Equity LifeStyle and Independence Realty have expected long-term growth rates for FFO per share of 4.9% and 5.0%, respectively.
Note: All EPS numbers presented in this write up represent funds from operations (“FFO”) per share. FFO, a widely used metric to gauge the performance of REITs, is obtained after adding depreciation and amortization and other non-cash expenses to net income.
5 Trades Could Profit "Big-League" from Trump Policies
If the stocks above spark your interest, wait until you look into companies primed to make substantial gains from Washington's changing course.
Today Zacks reveals 5 tickers that could benefit from new trends like streamlined drug approvals, tariffs, lower taxes, higher interest rates, and spending surges in defense and infrastructure. See these buy recommendations now >>
RealPage, Inc. (RP): Free Stock Analysis Report
Equity Lifestyle Properties, Inc. (ELS): Free Stock Analysis Report
Essex Property Trust, Inc. (ESS): Free Stock Analysis Report
Independence Realty Trust, Inc. (IRT): Free Stock Analysis Report
Original post
Zacks Investment Research
