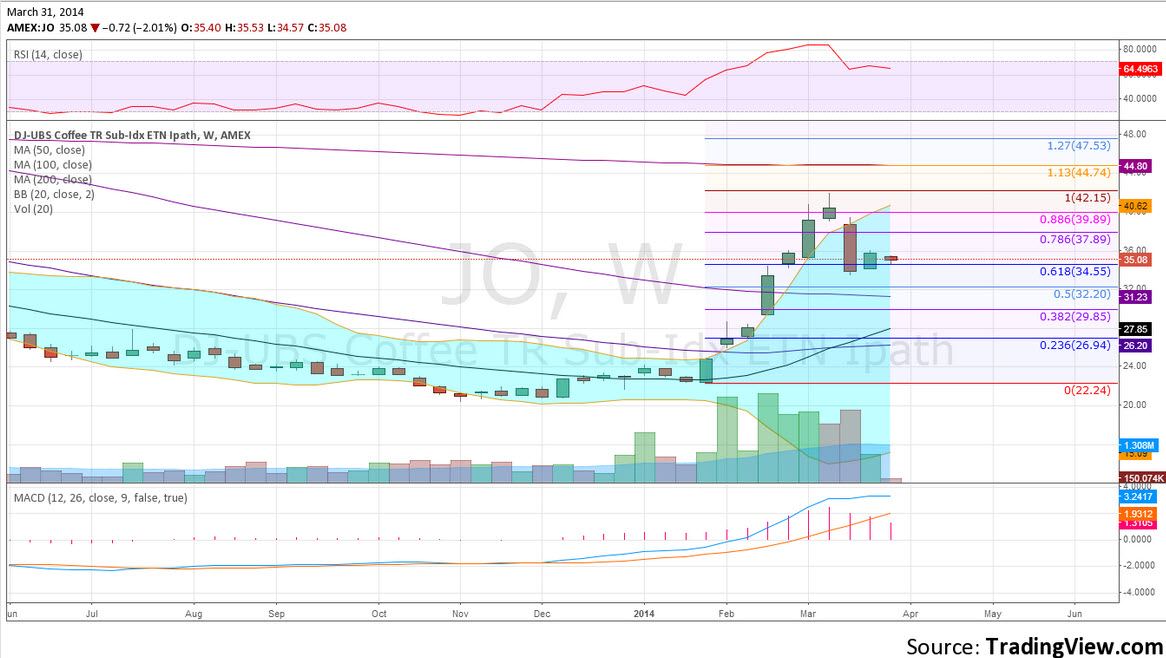
Many traders and investor know that Coffee (iPath DJ-UBS Coffee Total Return Sub-Index (JO)) went on a monster tear higher from late January through the middle of March. Over that time it rose nearly 20% before pulling back to where it is now, consolidating at about $35. I wonder how many of you realize though that Coffee was off over 60% in the two and a half years prior to that.
This recent ‘massive run up’ has not quite recovered 38% of the fall. Hopefully now you are not so scared about Coffee. Because with the recent cooling off it looks ready to start percolating again.

The weekly chart above shows four reasons to consider getting back in now. First, the chart is building nested Harami, or inside weeks, where the price range is smaller and does not make a new low. This is a signal that reversal may be near. Second, it has also retraced 61.8% of that move higher from January, a key level and a spot where technical traders will look for a reversal. Third, the price has moved back within the Bollinger® bands (blue area) signaling that actual volatility has decreased. Finally, the Relative Strength Index (RSI) has worked off the technically overbought condition.
None of these say that the reversal is imminent but all give a good opportunity to start a trade against a reasonable stop level at the weekly low two weeks ago. Perhaps start with a half position right here.
Disclosure: The information in this blog post represents my own opinions and does not contain a recommendation for any particular security or investment. I or my affiliates may hold positions or other interests in securities mentioned in the Blog, please see my Disclaimer page for my full disclaimer.
