We are seeing history being made here folks...
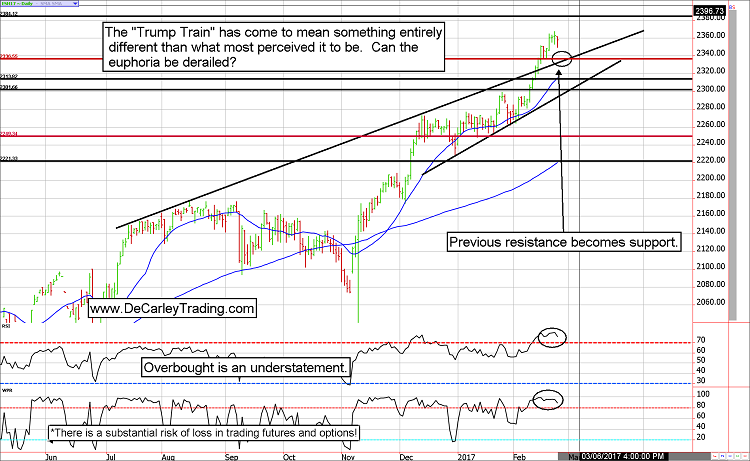
One of the fundamental concepts of market characteristics is they generally don't go straight up or straight down, yet that is exactly what we are seeing in the e-mini S&P 500 Futures. We are seeing the stock indices achieving record-breaking streaks in regard to new highs and muted volatility levels. For example, yesterday the Dow posted the 10th positive consecutive close for the first time in four years and there have been only four occasions in history in which we've seen more than 10 positive closes in a row. The Dow also closed at a new high for the 10th consecutive day for the first time since January of 1987. Similarly, the annualized volatility thus far in 2017 is 5.9%, the tamest start to a year since 1966. Just as concerning, the S&P has gone 92 days without a 1% decline, this is the longest streak since 2006 and the S&P hasn't had a 1% intraday move since December 15th, this is the longest such streak in history!
The point is, the one directional trade and lack of volatility we are seeing in the ES is rare. And it is also dangerous. You might have noted a few of the years referenced above being on, or just before, significant market declines. We happen to believe this bull has quite a bit of room to run in the long-run, so we aren't looking for an 1987-style crash but it is worth noting that "never-ending" rallies can be unstable once they finally correct. Caution is warranted.
ZB and ZN Futures

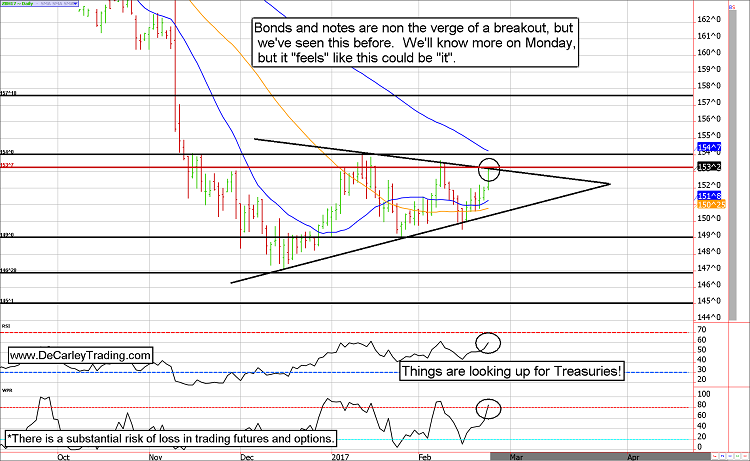
Options expiration and first noticed day for futures traders probably propelled today's Treasury rally
**You should be trading the June futures going forward!
As the COT report issued by the CFTC has been telling us all along, traders have been largely positioned on the short side of bonds and notes. Accordingly, today's option expiration and Tuesday's first notice day which is forcing traders to exit and defend holdings is exposing the overcrowded short trade.
For instance, we suspect there were a lot of traders with short 30-year bond call options but inclining Treasury prices this week likely forced them into buying futures contracts to hedge their positions. Naturally, this puts upward pressure on bond prices.
Similarly, with the March futures contract going into delivery soon. Futures traders are faced with the decision to either exit their holdings or roll them into the next contract month, in any case, the process will involve buying back the March bond and note futures for most traders (because the majority of traders are net short according to the COT report). As prices crept against their positions overnight, the motivation to buy became much more desperate and this put upward momentum on pricing.
Where does that leave us? According to the chart, we are on the brink of a breakout with a substantial number of nervous shorts. I wouldn't want to be a bear.
Treasury Futures Market Analysis
**Bond Futures Market Consensus:** It's make or break from here. We suspect we'll see an upside breakout.
**Technical Support:** ZB : 149'0, 146'28 and 145'01 ZN: 124'0, 123'20, 123'05 and 122'07
**Technical Resistance:** ZB: 153'07, 154'0, and 157'18 ZN: 125'21.5 and 126'11
ES Futures
Margin calls, short squeezing, and sidelined cash scrambling to get in on the action are forcing stocks higher
As noted above, we are witnessing the most peaceful market in history. At least that is what the stats say. For anybody short the e-mini, or sitting on cash in their investment accounts, this rally has been anything but peaceful. Nevertheless, it is real and so are the consequences for those involved. Somebody pinch me!
Stock Index Futures Market Ideas
**e-mini S&P Futures Market Consensus:**
It's a global short squeeze. Where it ends, nobody knows.
***We are now charting the March contract!**
**Technical Support:** 2336, 2313, 2301, and 2249
**Technical Resistance:** 2372 and 2384
e-mini S&P Futures Day Trading Ideas
**These are counter-trend entry ideas, the more distant the level the more reliable but the less likely to get filled**
ES Day Trade Sell Levels: Let's see what Monday looks like.
ES Day Trade Buy Levels: Let's see what Monday looks like.
In other commodity futures and options markets....
October 6 - Buy March Euro strangles using the 123 calls and the 100 puts for about $400. This trade is looking for a sharp increase in volatility.
November 14 - Sell March Euro 100 put for about 41 ticks to lock in $250 to $300 per contract. We are still holding the long call half of the strangle, which is under water.
January 6 - Buy March ES 2025 puts for about 7.50 in premium ($375).
January 18 - Sell April live cattle 127 calls near 97.5 ticks ($390).
January 27 - Buy a June ZN (10-year note) future near 123'16.5 and sell a 123 call for about 1'50. Risk is unlimited under 123, reward is about $1300 at expiration if the futures price is above 123'0.
January 31 - Buy back April Live Cattle 127 call to lock in a quick profit of anywhere from $200 to $250 per contract before transaction costs.
January 31 - Buy back March ES 2345 calls near 4.75 to lock in a profit of roughly $200 to $250 per contract before transaction costs.
February 9 - Sell long ES 2025 puts to salvage remaining premium (a little less than 2.00 points).
February 15 - Let's add to our short ES call position by selling the April 2400 call for about 10.00
(Our clients receive short option trading ideas in other markets such as gold, crude oil, corn, soybeans, Euro, Yen, and more. Email us for more information)
Carley Garner
DeCarley Trading (a division of Zaner)
Twitter:@carleygarner
info@decarleytrading.com
1-866-790-TRADE(8723)
www.DeCarleyTrading.com
www.HigherProbabilityCommodityTradingBook.com
**There is substantial risk of loss in trading futures and options.
** These recommendations are a solicitation for entering into derivatives transactions. All known news and events have already been factored into the price of the underlying derivatives discussed. From time to time persons affiliated with Zaner, or its associated companies, may have positions in recommended and other derivatives. Past performance is not indicative of future results. The information and data in this report were obtained from sources considered reliable. Their accuracy or completeness is not guaranteed. Any decision to purchase or sell as a result of the opinions expressed in this report will be the full responsibility of the person authorizing such transaction. Seasonal tendencies are a composite of some of the more consistent commodity futures seasonals that have occurred over the past 15 or more years. There are usually underlying, fundamental circumstances that occur annually that tend to cause the futures markets to react in a similar directional manner during a certain calendar year. While seasonal trends may potentially impact supply and demand in certain commodities, seasonal aspects of supply and demand have been factored into futures & options market pricing. Even if a seasonal tendency occurs in the future, it may not result in a profitable transaction as fees and the timing of the entry and liquidation may impact on the results. No representation is being made that any account has in the past, or will in the future, achieve profits using these recommendations. No representation is being made that price patterns will recur in the future.
