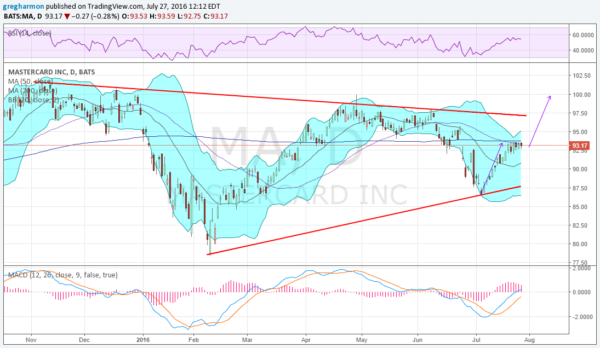
Mastercard Incorporated (NYSE:MA) has been in a tightening range since making a top in November. After making a series of lower highs and then higher lows, the price action has formed a symmetrical triangle. It is a little more than 50% of the way into the apex, approaching the power zone 2/3 of the way though. A break of this triangle would look for a move of about $21.
Into Thursday's earnings, the stock price is in the middle of the range after a 4th touch, at the lower rail. It is also right at its 200-day SMA, which has been running flat for 7 months. With the 50-day SMA crossing down -- a death cross -- there's one indication of a possible pullback soon.
The RSI is stalling and moving sideways before a move into the bullish zone and the MACD is rising having just moved into positive territory. A mixed picture from momentum. The Bollinger Bands® have turned and opened higher. A Measured Move to the upside out of consolidation would target a run to 100, breaking the triangle along the way. I’d give the chart a marginal bias to the upside.
The weekly options show traders pricing in a $3.10 move (3.3%) by Friday. This compares to the average of the moves following the last 6 earnings reports of about 2.0%. Open interest is biggest on the Put side at the 92 and 94.5 strikes. On the Call Side it is biggest at 91 and then spread from 92.5 to 95. Short interest is less than 1% in this name. Options this week show no bias.
Trade Idea 1: For the long holder, protection can be had by buying a weekly 92 Put for about $1.05. This gives protection as far down as the stock might go. If comfortable that the options traders have the move measured correctly at $3.00 then you can also sell the weekly 90 Put for about 50 cents to cut your cost in half. The selling an August 97.5 Covered Call for 50 cents brings your down even further. Full Collar: Long July 29 Expiry 92/90 Put Spread and selling August 97.5 Call for free.
Trade Idea 2: For the speculator there are two choices. The first is to sell the range with a July 87.5/97.5 Strangle. But this only pays 1/2%. Moving this out to August expiry pays $1.00 or a little over 1% for a 3 week period. The second choice is a trade biased to the upside. Buying the July 93.5/96 Call Spread costs about 95 cents. Selling the July 90 Put cuts that cost by over 50% but adds the risk of owning the stock at 90. Call Spread Risk Reversal: Buy the July 29 Expiry 93.5/96 Call Spread and sell the July 29 Expiry 90 Put for 47 cents.
Trade Idea 3: If you wish to own this stock, but from a lower level, then a 1×2 Put Spread fits your view. The July 92.5/90 1×2 Put Spread (buying the 92.5 Put and selling 2 of the 90 Puts) costs about 25 cents. That is your maximum risk if the stock moves higher. If it moves lower then you participate in the downside from 92.25 to maximum profit at 90. Below 90 you will be put the stock with a basis of 87.75. July 29 Expiry 92.5/90 1×2 Put Spread for 25 cents.

