Investing in Emerging Markets has been a hot topic lately. This after a year long decline in 2018 that saw the Emerging Markets ETF drop over 25%. Is it just a reversion to the mean trade? For some it is. But there are some very interesting things going on in the price action that bear watching.
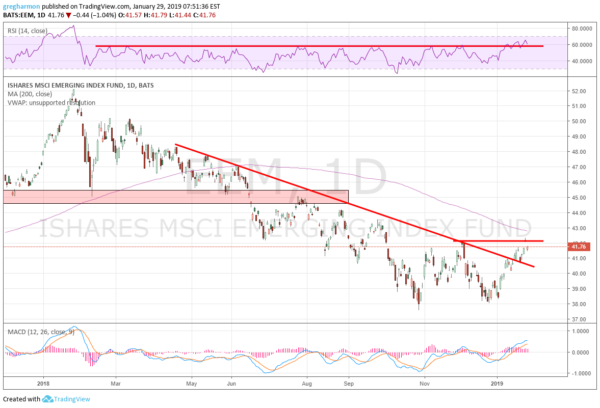
The chart below shows the Emerging Markets ETF, $(NYSE:EEM), since its peak in January 2018. There was the quick pullback to long term support when the broad markets fell and then the bounce. But unlike the U.S. markets, they did not rebound and retest the highs in September. Instead the Emerging Markets ETF just kept sinking, making a low at the end of October.

The bounce that followed failed at falling trend resistance and price reverted to the lows. And this is where the story gets interesting. The fall stopped at a higher low. Eyebrows were raised. Since then the price has pushed up through that trend resistance, retested it as support and continued higher.
This puts Emerging Markets in the spotlight and highlights three things to watch for in the chart. The first is the December 1 high. Price marginally broke above this level Friday but did not hold at the end of the day. A hold above would be a higher high to go with the higher low, the possible start of a reversal.
The second is the RSI moving up over the 60 level. Holding here, in the bullish zone at levels not seen since January last year is a big shift in momentum. The third item is the 200 day SMA. Price has not maintained above it since May. A move over the 200 day SMA, along with the other two characteristics, would attract a lot of buyers.
Disclaimer: The information in this blog post represents my own opinions and does not contain a recommendation for any particular security or investment. I or my affiliates may hold positions or other interests in securities mentioned in the Blog, please see my Disclaimer page for my full disclaimer.
Original post
