Although market conditions are not yet ideal for trading on the long side, it’s always a good idea to keep on top of the best looking charts so that we are prepared to move if/when conditions turn bullish.
Below are a few stocks from our internal watchlists that we are monitoring.
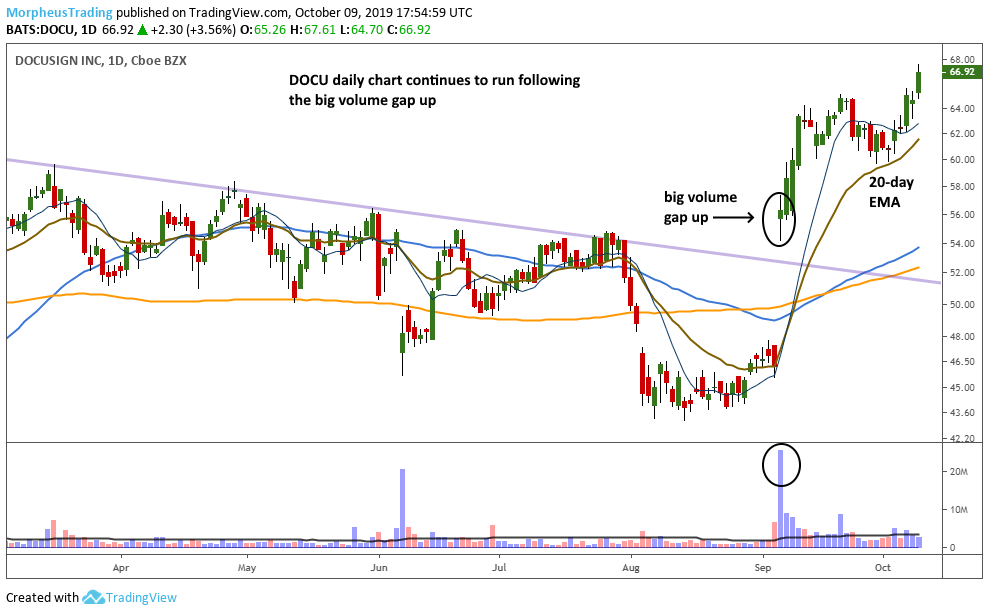
DocuSign (DOCU)
A big volume breakaway gap up on October 6 sparked the current rally. Despite unreliable market conditions, DocuSign Inc (NASDAQ:DOCU) continues to march higher while holding on to the 20-day moving average. If/when market conditions improve, this could be one of the first charts we look to enter if near a decent buy point.
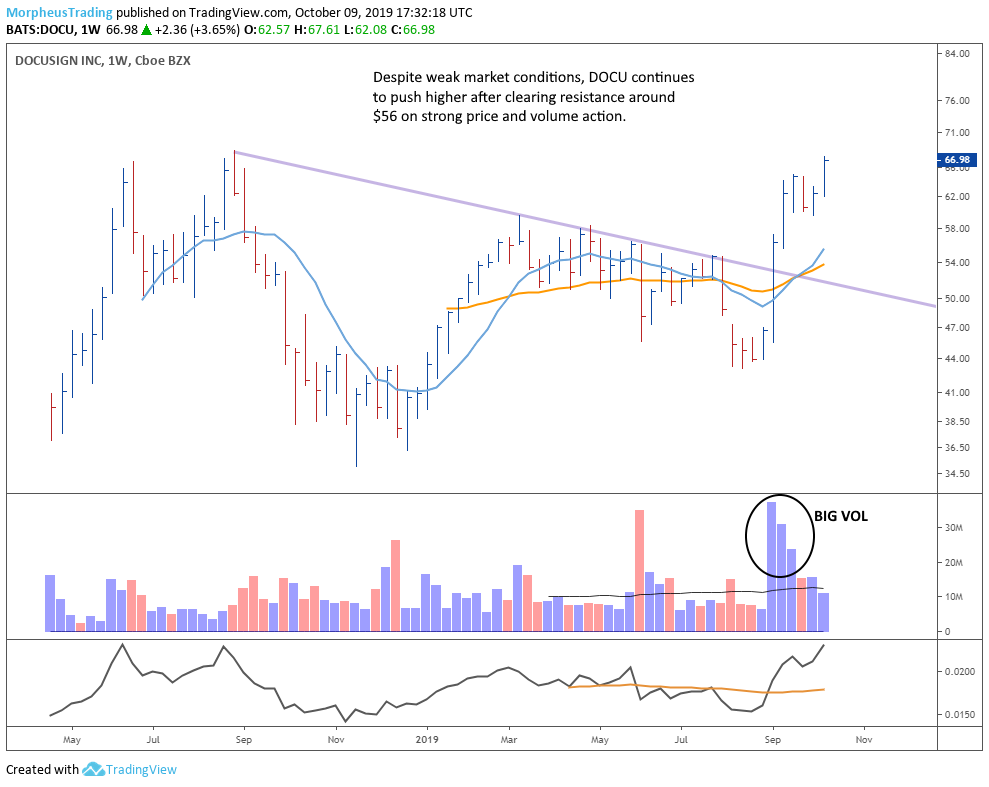
The weekly chart shows the big volume on the move up.
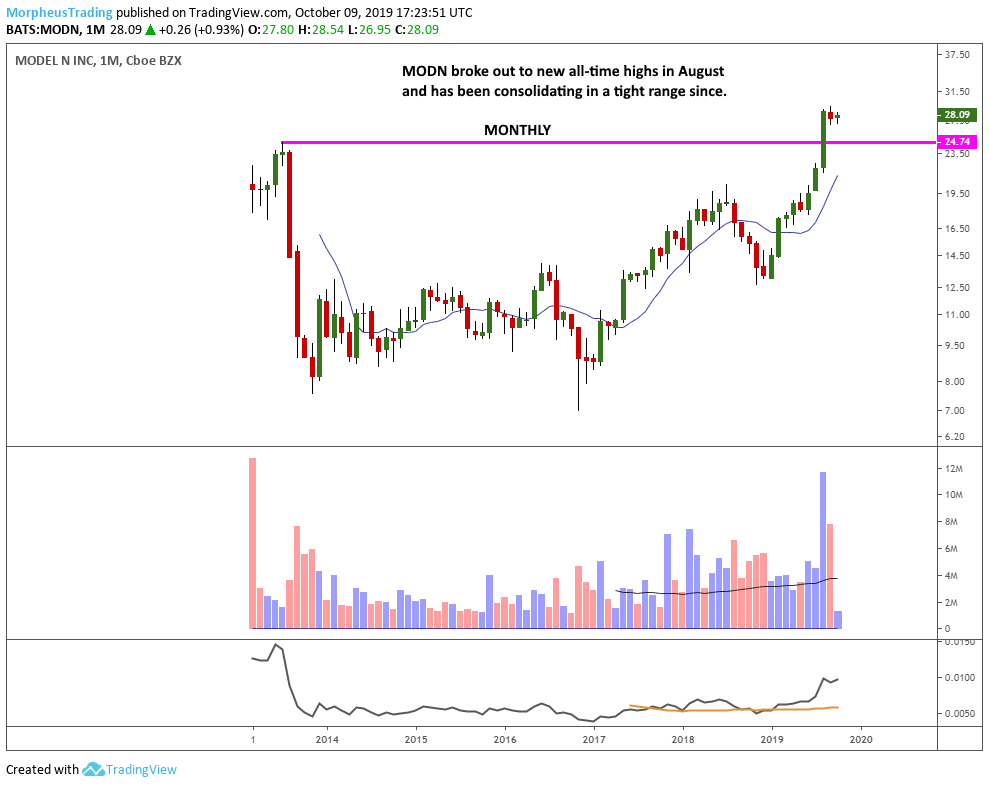
Model N (MODN)
Recently broke out to new all-time highs on the monthly chart below.
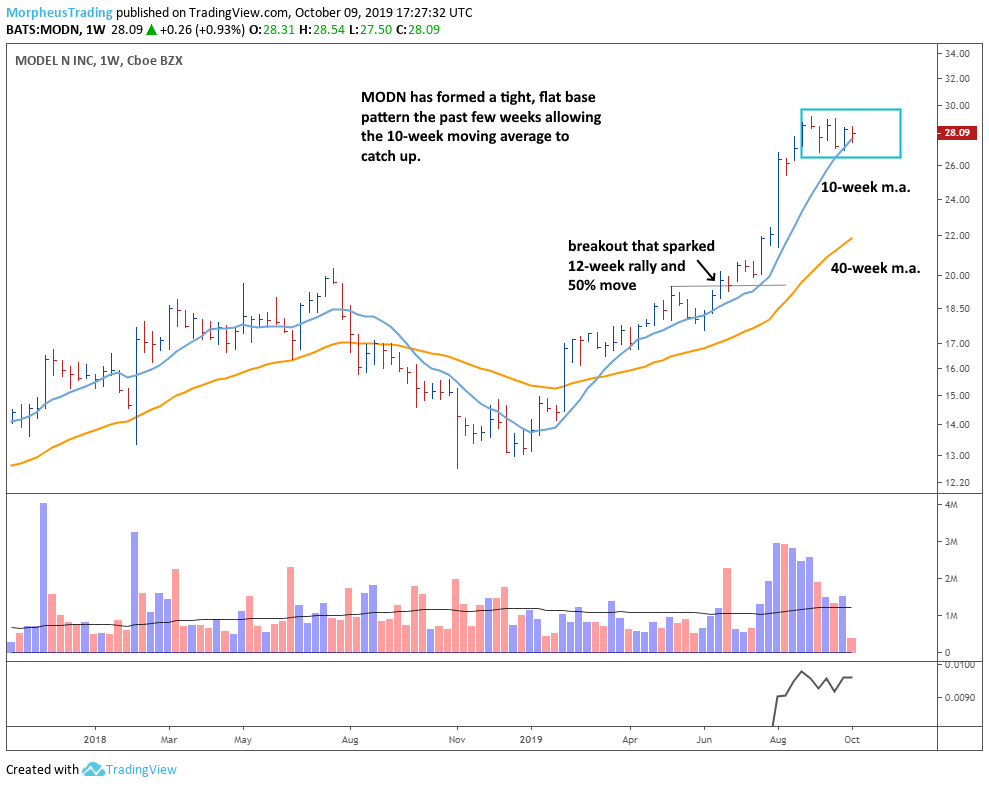
The weekly chart details the breakout that led to a powerful 50% advance in 12 weeks. After stalling just below $30, a bullish basing pattern known as a flat base has developed. A flat base is at least 5-weeks in length and corrects no more than 15% off the recent high. Note that the 10-week moving average has caught up to provide support.
Depending on market conditions, Model N Inc (NYSE:MODN) may be worthy of an entry prior to the obvious breakout entry above range highs. This stock could be ready to explode higher with a little help from the market.
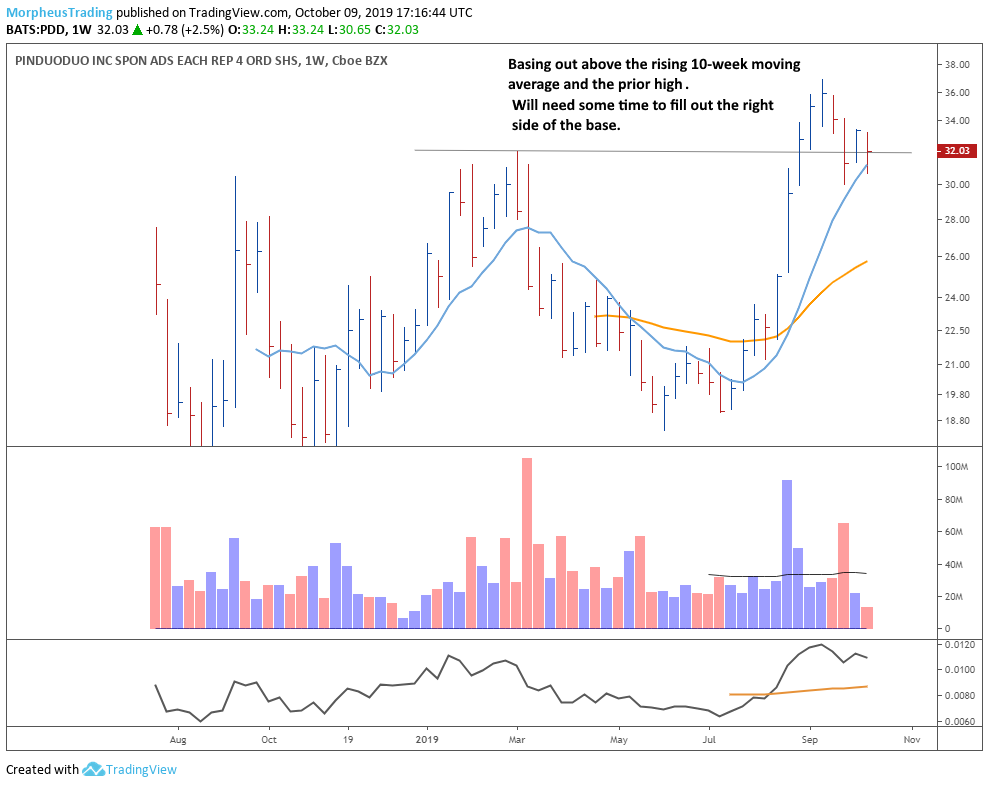
Pinduoduo (PDD)
The last chart is a weekly of Pinduoduo (NASDAQ:PDD), which is a Chinese based stock that IPO’d in mid-2018. The price nearly doubled off range lows in 8-weeks while setting a new all-time high in August.
PPD found support less than 20% off range highs, which is a very tight pullback given how explosive the last move up was (a bullish sign). The 10-week moving average has caught up and should offer additional support.
$PDD will need some time to fill out the right side of its base but we look for this stock to become an explosive mover down the road.
