What’s better than a 6% yield paid every quarter?
An 8% annual yield—paid every month—of course.
These hidden gems aren’t easy to find, but they are out there. While 99% of the market’s dividend payers dish out dollars every quarter or longer, it is possible to find dividends that match up with our monthly bills.
Monthly dividends can be a “must have” in retirement. While those in the workforce can cash a check once or twice a month, retirees don’t have active income. (That’s the point of retirement—less required activity!)
Our leisure and financial security is possible. We simply need our money to work harder for us.
In this spirit, quarterly blue-chip stocks often come up short. They send out “lumpy” payments. For instance, a big January might be followed by a so-so February and a lean March.
Some investors go through the complicated process of building a “dividend calendar” in which they hold specific amounts of specific stocks to make sure their monthly payouts even out, but if just one of those stocks cuts their payouts, that balance is sent reeling.
Not so with monthly dividend stocks.
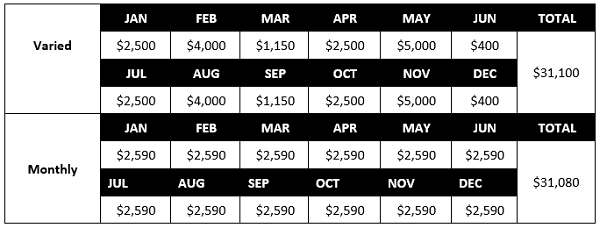
Check out the table below. Up top is the dividend schedule for a 6.2%-yielding dividend portfolio made up of “normal” stocks. Below that is the income from a trio of dividend stocks and funds yielding the same amount, just delivering it each and every month. Both deliver $31,000 in annual income—not on a million-dollar nest egg, but on a mere $500,000 investment—but it’s pretty obvious which manner we’d prefer:

Better still, these dividends are paid by extremely consistent and reliable companies.
The question is: Are these monthly dividend payers buys today? Let’s look at this 6.2%-yielding three-pack to see where the best opportunities lie.
1. Pembina Pipeline
- Dividend Yield: 6.8%
Calgary-based Pembina Pipeline Corp (NYSE:PBA) has been a part of North America’s energy infrastructure for more than six decades, dealing in the transportation, storage and processing of crude oil, natural gas and natural gas liquids, primarily in Western Canada but also parts of the U.S.
It does so across 18,000 kilometers of pipelines, several natural gas and processing assets, and a bulk marine export terminal in Vancouver.
Like most of the energy sector, and specifically many of its pipeline peers, Pembina shares cratered during the COVID-19 downturn and still haven’t fully recovered to pre-pandemic prices.
Unlike a too-high number of its peers, though, PBA didn’t lay a finger on its monthly dividend throughout the crisis. It raised its monthly payout to 21 cents per share at the start of 2020, where it has remained ever since. That speaks to Pembina’s ample cash generation and strong balance sheet.
Pembina pipes energy around, so ultimately, it tends to trade with oil prices, which means we care about supply and demand. Well, according to the International Energy Agency (IEA) – the best source of industry information in my book – global oil demand should reach 96.4 million barrels per day. But global oil supply is just 93.6 million barrels per day.
That’s another checkmark for PBA, as is the fact that it’s a corporation, not a master limited partnership (MLP), meaning we get to avoid the dreaded Schedule K-1 come tax time. That’s good, but it’s not the best play in the space.
2. DNP Select Income Fund
- Dividend Yield: 7.7%
It’s hard to get more dependable than the utilities sector, whose components operate as virtual monopolies in one of the most boring, but steadiest, businesses on the planet.
Still, as California’s PG & E (NYSE:PCG) and its 75% plunge of the past few years has taught us, no stock—not even a utility—is bulletproof. So, like with any part of your portfolio where the highest priority is simply avoiding an implosion, you’re probably better off spreading the risk around.
The DNP Select Income Closed Fund (NYSE:DNP) does exactly that—and it does it in some ways that many of its exchange-traded fund (CEF) competitors won’t, or can’t.
DNP Select Income invests across traditional electric and water utilities such as Eversource Energy (NYSE:ES), Southern Co. (NYSE:SO) and American Water Works (NYSE:AWK). But it also holds utility-esque companies such as Crown Castle International (NYSE:CCI), a real estate investment trust (REIT) that owns telecommunications infrastructure and leases it out to the likes of AT&T (NYSE:T) and Verizon (NYSE:VZ). And it even holds a few MLPs.
It goes a step further by investing not just in equities, but also bonds, with 15% of the portfolio currently in debt and cash. And it also uses debt leverage (a fairly high 25%) to amplify its exposure, which also helps it achieve a lofty yield of 7.7%.
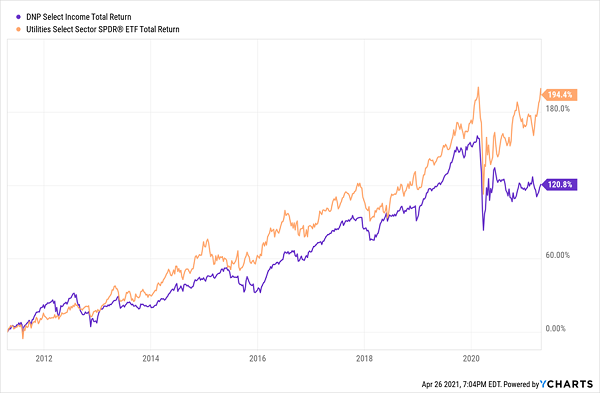
And yet, DNP underperforms a simple index. What it dishes in dividends, it lacks in price appreciation:
DNP Trails a Simple Index

DNP has underperformed a plain utilities index over time. That’s bad enough, but consider this: DNP charges more than 2.01% in expenses between management, interest and other fees, versus just 0.12% for the Utilities Select Sector SPDR® Fund (NYSE:XLU).
Of course, these fees are paid from their net asset values (NAVs). They are also net of yields. We don’t worry too much about fees when the performance is paying for them. But that isn’t the case here.
Worse still is that, at current prices, you’d be paying a nearly 5% premium for DNP compared to the value of its net assets.
DNP’s monthly payments don’t make up for all those shortcomings. It’s not worth paying $1.05 for one collar of its assets.
3. Realty Income
- Dividend Yield: 4.1%
Could you ask for a monthly dividend more reliable than the one paid out by a company that bills itself as “The Monthly Dividend Company”?
Realty Income (NYSE:O) lays out the goods right on its homepage: 609 consecutive monthly dividends paid, 4.4% annualized dividend growth since 1994, 94 consecutive quarterly increases to the monthly payout.
What’s powering that is a portfolio of more than 6,500 properties leased out to more than 600 clients across 49 states, Puerto Rico and the U.K. Those clients are spread across more than 50 different industries, and while its top tenants are can’t-miss operators such as Walgreens (NASDAQ:WBA), 7-Eleven and Dollar General (NYSE:DG), no single client makes up more than 6% of annualized rental revenue.
Better still, these agreements are almost exclusively “net leases,” meaning they’re net of taxes, insurance and maintenance. The tenants take care of those, leaving Realty Income to simply sit around and collect a predictable, reliable income stream.
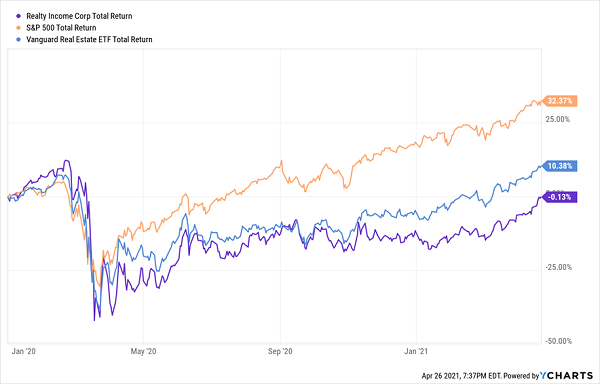
Realty Income’s Rebound Lags the Market, Even REIT Peers

However, brick-and-mortar retail has looked dicey for years. And while Realty Income mostly delves in “necessary” retailers such as drugstores and dollar stores that should do well despite the march of e-commerce several of its big tenants—theaters and gyms—took a hit from COVID that they might never recover from.
(Note: As we went to print, news broke that Realty had agreed to acquire VEREIT (NYSE:VER) in an all-stock transaction. We would not be buyers of either stock at this moment.)
Disclosure: Brett Owens and Michael Foster are contrarian income investors who look for undervalued stocks/funds across the U.S. markets. Click here to learn how to profit from their strategies in the latest report, "7 Great Dividend Growth Stocks for a Secure Retirement."
