Here’s something most people don’t realize: in the world of high-yield closed-end funds (CEFs), 7% dividends are actually on the smaller side.
While the more conventional ETFs will pay you 3% if you’re lucky, high-yield closed-end funds can pay out a lot more.
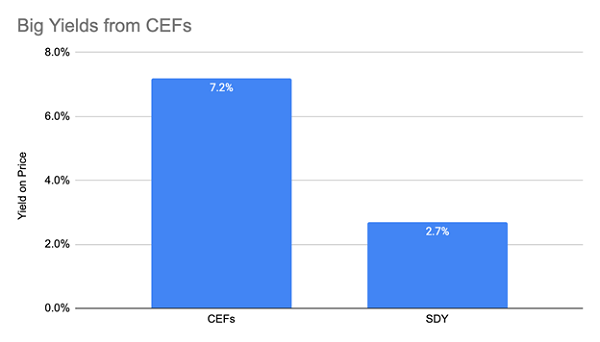
With an average yield of 7.2%, according to data from my CEF Insider service, CEFs pay much more than the SPDR S&P Dividend (NYSE:SDY), which yields a meager 2.7%!

There are some off-the-beaten path ETFs that do have big yields, like the Global X SuperDividend™ ETF (NYSE:SDIV), which pays a shocking 12.3% dividend as I write this. But don’t be fooled; these high-yield ETFs are sometimes wolves in sheep’s clothing.
While SDIV’s income stream looks impressive, a deeper dive shows real cause for concern. The fund focuses almost exclusively on dividend yield when choosing stocks to buy, which is why its performance has been poor.
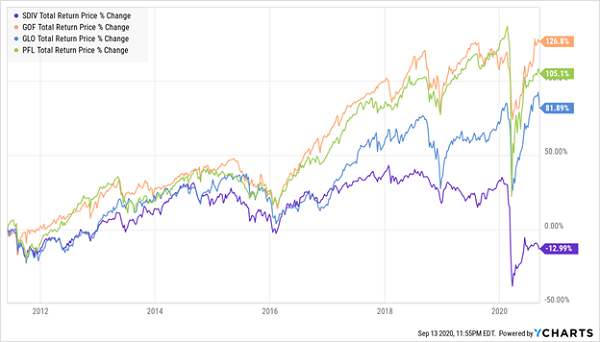
In fact, we can use three similarly high-yielding CEFs to show where SDIV falls short. For this example, I have taken the Pimco Income Strategy Closed Fund (NYSE:PFL), Guggenheim Strategic Opportunities Closed Fund (NYSE:GOF) and Clough Global Opportunities Fund (NYSE:GLO). These funds are all high yielders, with payouts of 11.5% on average, a bit less than SDIV, but very much in the ballpark.
And all of these funds have crushed SDIV.
CEFs The Clear Winner

Let’s put this chart in perspective. If you invested $100,000 in these three CEFs in 2011, when SDIV held its IPO, you’d now have $204,590, including the $1,961 monthly income stream from these funds.
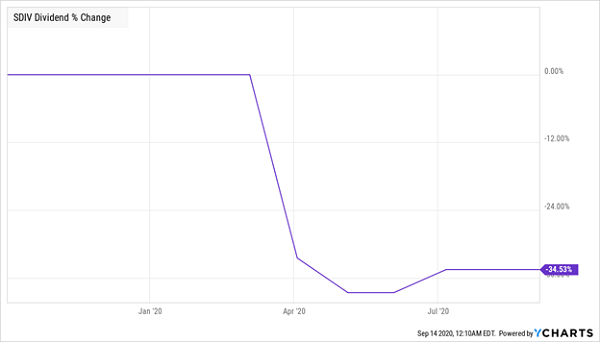
But with SDIV, you’d have $87,010—less than you started with! And your income stream would be just $906.33, less than half of the CEF portfolio alternative. (As you’ll see below, SDIV’s dividend payout has been less than stable.)
Why the big difference? Because total returns are vital to take into account.
The total return is the combined capital gains and income you get from an investment. A fund that loses your money while giving you an income stream, like SDIV has done, cannot compound. I think you’ll agree that this is no way to create wealth.
CEFs, fortunately, deliver both capital gains and income streams. There are literally hundreds of CEFs that deliver both and have been delivering both for a decade or longer.
But why can’t SDIV re-create this kind of performance? Why are CEFs different? The answer boils down to regulation and incentives—and it’s a story worth digging into.
Why CEFs Beat High-Yield ETFs
CEFs are regulated by the Investment Company Act of 1940, which sets limits of what these funds can do. One of the things the law does not require is daily reporting of portfolio changes. As a result, CEF managers can actively manage their funds without their competitors seeing what they’re doing.
ETFs are different. They’re required to report their holdings every day, so buy and sells are immediately known. This is why there are so few actively managed ETFs; anyone could look at their portfolio and copy their strategy immediately.
As a result, ETFs tend to be managed by a bunch of rules that dictate what can and cannot be sold, according to an algorithm or some broad idea. In SDIV’s case, the idea is simply to invest in high-yielding stocks around the world. It’s a simple strategy that does not account for changes in the economy.
CEFs, on the other hand, can (and do) adapt to market changes: every non-energy equity CEF tracked by CEF Insider has outperformed SDIV since that fund’s inception for obvious reasons: the equity CEFs have management that can (and does) react to market changes. SDIV does not.
This also means that most equity CEFs invest in well-known, top-performing companies. Would it surprise you to learn that Amazon (NASDAQ:AMZN), Apple (NASDAQ:AAPL) and Microsoft (MSFT) are some of the most popular holdings in CEFs?
But SDIV, because of its mandate, doesn’t own any of these firms. Similarly, a couple of tech CEFs recorded strong gains in 2020 by buying and selling Tesla (NASDAQ:TSLA) as that company’s stock jumped and plunged this year. Again, that’s something SDIV can’t do.
These are just the start. Thanks to their structure and freedom, CEFs can give you a diversified portfolio of many assets—tech stocks, real estate, corporate bonds, municipal bonds, preferred stocks—that shelters you from a decline in any one asset class while giving you stable income all the while.
Very few CEFs cut their dividends during the COVID-19 selloff in March, and more are beginning to increase their payouts now that the market is recovering. Meanwhile, SDIV’s payouts are dropping because it cannot adapt to the pandemic.
SDIV’s Dividend Wilts

The bottom line? For high yields that stay high, CEFs are clearly a far better choice than ETFs.
Shocking: These CEFs Made Money 98.4% of the Time (and Yield 7%+)
I’ve uncovered something else about CEFs that I know will surprise you.
Get this: of the 326 CEFs out there that are a decade old (or older), only 16 have lost money in the last 10 years! That’s a 95% “profit rate.”
There’s more: of the 16 CEFs that did lose money, all but 5 were in the energy sector. Dump those 11 laggards, and that win rate jumps to 98.4%!
That’s an incredible performance. So much so that I checked my numbers three times to make sure they held up (I assure you they did).
I’m sure you’ll agree that a performance like that makes CEFs the perfect investment for today, with the market rebound feeling pretty shaky. And with the average CEF yielding 7.2% now, these funds also give us a high income stream to help pay our bills—or build up a nice cash reserve in case the market pulls back again.
That’s why I’ve pulled together my 5 favorite CEFs for this uncertain time. They’re all cheap now (which helps hedge your downside) AND these 5 stout income plays yield even more than the CEF average: I’m talking about a yield just above 8% here.
Drop $500K into these 5 funds and you’ll kick-start a $41,000 yearly income stream!
Disclosure: Brett Owens and Michael Foster are contrarian income investors who look for undervalued stocks/funds across the U.S. markets. Click here to learn how to profit from their strategies in the latest report, "7 Great Dividend Growth Stocks for a Secure Retirement."
