EUR/JPY - Trying to rise
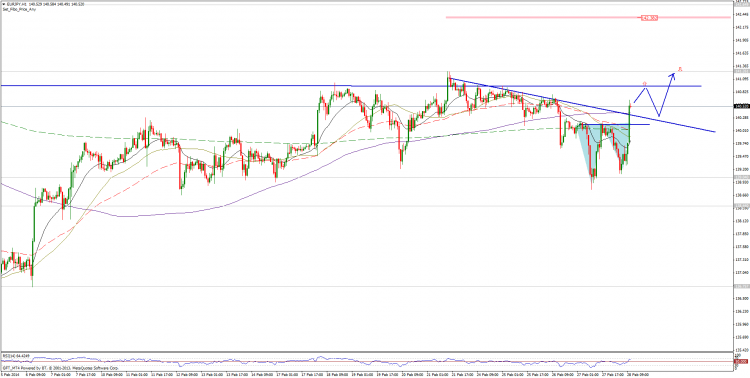
Hourly chart: The pair has seen quite the action as it was traded up and down within the narrow range, ultimately failing to break below 139. This resulted in a small double bottom, which was the source of the breakout after the european data was released.
We should see the currency pair reach the resistances at 141-141,2 and if it breaks through them then the next big goal would be to reach the 142,2 levels.
The moving averages are now below the price action, and we expect the 140 level to be a very strong support. These two factors combined should be enough to cause the pair to bounce In case the EUR/JPY sells of to this level. EUR/JPY" title="EUR/JPY" height="277" width="464">
EUR/CAD - Conquering 1,53
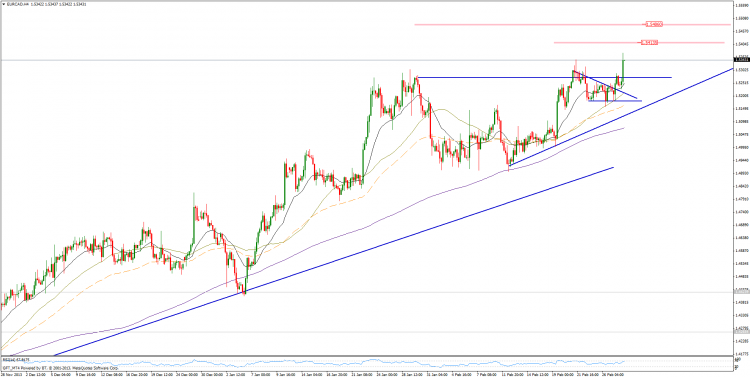
4 Hour chart: After a long preparation the EUR/CAD pair finally broke through the 1,53 level. The target prices for this breakout are at 1,5410 and 1,5480.
If we want to see this move succeed then the 1,52 level must not be broken, but it would be even better for the momentum in case the 1,5270 level holds. EUR/CAD" title="EUR/CAD" height="277" width="464">
NZD/JPY - Pressed higher
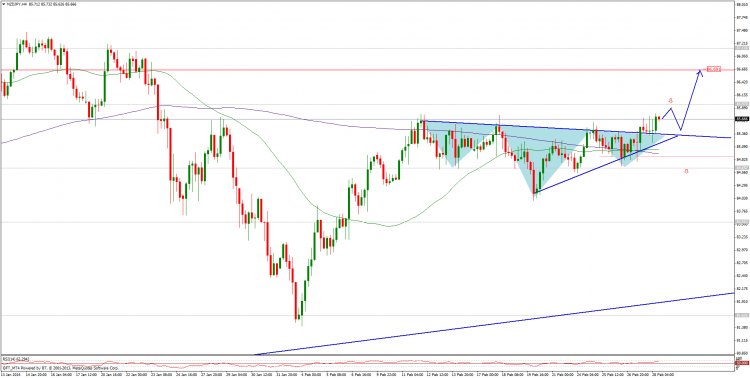
4 Hour chart: The currency pair seemed to be entangled with the 200 moving average, but it seems that it has overcome this burden.
The inverted head and shoulders chart pattern which was formed around 85,35 appears to be validated as well, since the NZD/JPY has broken above the neckline and is attempting to climb higher. The target price derived from this formation should bring us close to the previous highs, but there is a rather strong resistance at 86 which should offer a challenge.
In case this breakout is sold off below the neckline, or rather below 85 and the moving averages around it, then it should be categorized as a fake breakout, which could spark more selling. NZD/JPY" title="NZD/JPY" height="277" width="464">
- English (UK)
- English (India)
- English (Canada)
- English (Australia)
- English (South Africa)
- English (Philippines)
- English (Nigeria)
- Deutsch
- Español (España)
- Español (México)
- Français
- Italiano
- Nederlands
- Português (Portugal)
- Polski
- Português (Brasil)
- Русский
- Türkçe
- العربية
- Ελληνικά
- Svenska
- Suomi
- עברית
- 日本語
- 한국어
- 简体中文
- 繁體中文
- Bahasa Indonesia
- Bahasa Melayu
- ไทย
- Tiếng Việt
- हिंदी
3 FX Opportunities
Latest comments
Loading next article…
Install Our App
Risk Disclosure: Trading in financial instruments and/or cryptocurrencies involves high risks including the risk of losing some, or all, of your investment amount, and may not be suitable for all investors. Prices of cryptocurrencies are extremely volatile and may be affected by external factors such as financial, regulatory or political events. Trading on margin increases the financial risks.
Before deciding to trade in financial instrument or cryptocurrencies you should be fully informed of the risks and costs associated with trading the financial markets, carefully consider your investment objectives, level of experience, and risk appetite, and seek professional advice where needed.
Fusion Media would like to remind you that the data contained in this website is not necessarily real-time nor accurate. The data and prices on the website are not necessarily provided by any market or exchange, but may be provided by market makers, and so prices may not be accurate and may differ from the actual price at any given market, meaning prices are indicative and not appropriate for trading purposes. Fusion Media and any provider of the data contained in this website will not accept liability for any loss or damage as a result of your trading, or your reliance on the information contained within this website.
It is prohibited to use, store, reproduce, display, modify, transmit or distribute the data contained in this website without the explicit prior written permission of Fusion Media and/or the data provider. All intellectual property rights are reserved by the providers and/or the exchange providing the data contained in this website.
Fusion Media may be compensated by the advertisers that appear on the website, based on your interaction with the advertisements or advertisers.
© 2007-2025 - Fusion Media Limited. All Rights Reserved.
