It’s been a rough start to 2015 for many global investors, with energy, commodities, equities, and higher-yielding currencies falling sharply on the year’s first Monday. In classic risk-off trade, the primary beneficiaries of traders’ unease have been the Japanese yen, U.S. dollar and U.S. government bonds. Not surprisingly, the global bout of risk aversion has also hit EM FX across the board. Below we focus on the outlook for three pairs at interest levels.
-
USD/MXN: Key Psychological Resistance Looms at 15.00
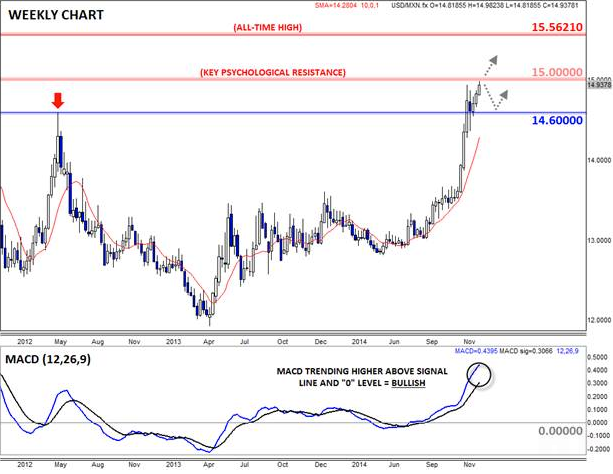
Throughout most of last year, the Mexican peso held up well against its northern neighbor. It was only in the last five weeks that the Mexican peso succumbed to the broad-based dollar rally. As we start a new trading year, USD/MXN is trading at a nearly 6-year high near 15.00, up from the mid-13.00s just two months ago.
Objectively, the Mexican peso is in a better fundamental position than many of EM rivals, given its close ties to the strong US economy and relatively low exposure to commodity prices. Therefore, key psychological resistance at 15.00 may lead to a near-term top in the pair. However, if that level is eclipsed, a move up to its all-time high at 15.56 is possible.

Source: FOREX.com
-
USD/ZAR: About to Boil Over 11.84?
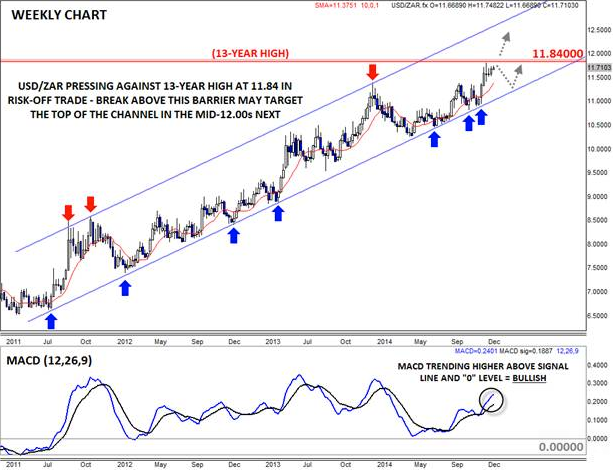
Like USD/MXN, USD/ZAR is pressing against a key resistance level as we go to press. South Africa’s economy has been hit by its exposure to mining and metals, but has avoided the worst of the risk-off move that its oil-dependent rivals have seen (see USD/RUB commentary below). Nonetheless, USD/ZAR is pressing against its 13-year (!) high at 11.84. If this level breaks, a move back to the top of the bullish channel in the mid-12.00s appears likely later this quarter.

Source: FOREX.com
-
USD/RUB: Rocked by Oil’s Drop
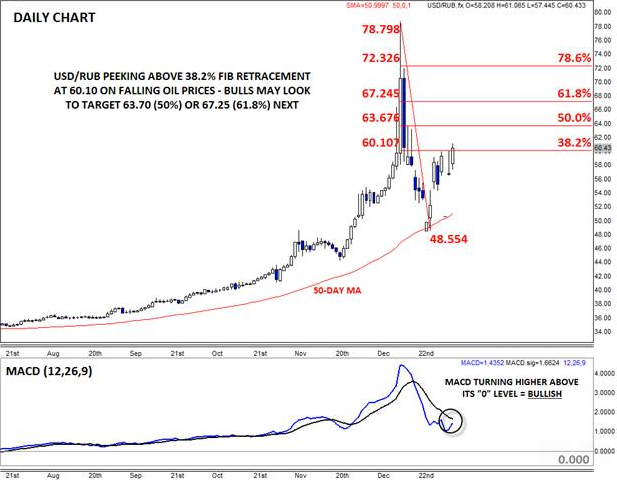
Earlier today, my colleague Fawad Razaqzada highlighted how oil prices are trading down sharply and plumbing new multi-year lows to start this year. As we found out at the end of last year, Russia’s currency is particularly levered to oil prices, so it’s not surprising to see ruble trading sharply lower today on the back of oil’s drop. While the Central Bank of Russia’s bold interest-rate hike in mid-December may prevent another outright panic in the currency, the longer-run impact of collapsing oil prices and high interest rates should keep USD/RUB well supported.
On a technical basis, the currency pair is pressing against the 38.2% Fibonacci retracement of the late December drop at 60.10, but a break above that level could easily expose 63.70 (50%) or 67.25 (61.8%) next. For now, the path of least resistance for USD/RUB remains higher.

Source: FOREX.com
For more intraday analysis and market updates, follow us on twitter (@MWellerFX and @FOREXcom).
