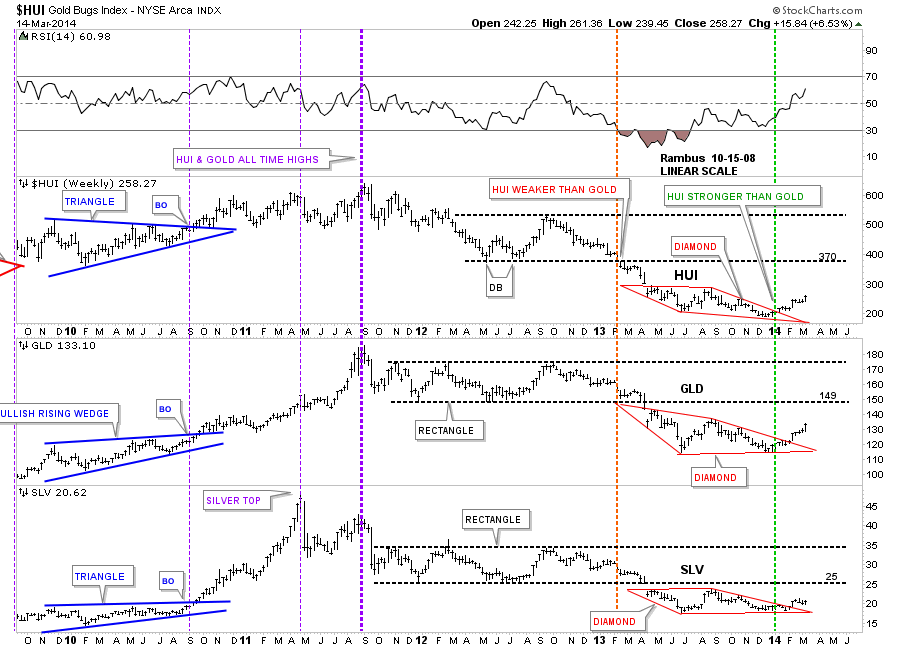
I’ve shown you several comparison charts with the Gold Bugs Index, HUI, SPDR Gold Trust ETF, (GLD) and iShares Silver Trust ETF, (SLV) that shows they all tend to break out at roughly the same time. One can sometimes be stronger than the others but still, they tend to break out at the same time. This past week was no exception. All three broke out of their consolidation patterns this week. Who would have thunk it.
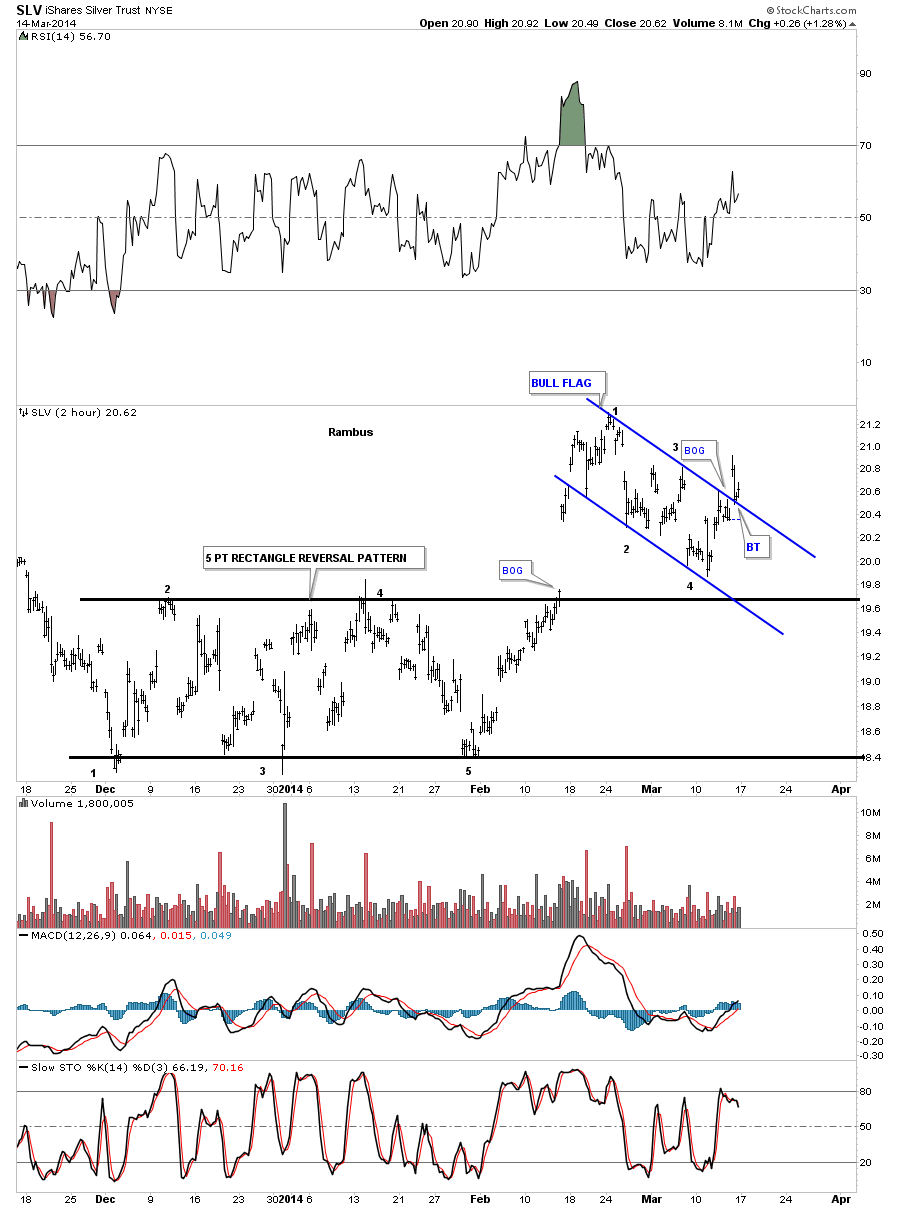
First, lets look at SLV. The chart shows that the bull flag we’ve been following since SLV broke out from the 5 point rectangle reversal pattern. Thursday the price action hit the top blue rail and fell back, just as you would expect on the inital hit. The question was how many bears were on the other side of that top blue rail? Friday answered that question without a doubt. The big gap up Friday morning told us the bears were gone and they are now in retreat, looking for new high ground they will try to defend. Below is a 2 hour, 4 month chart for SLV that shows the breakout Friday and the backtest.

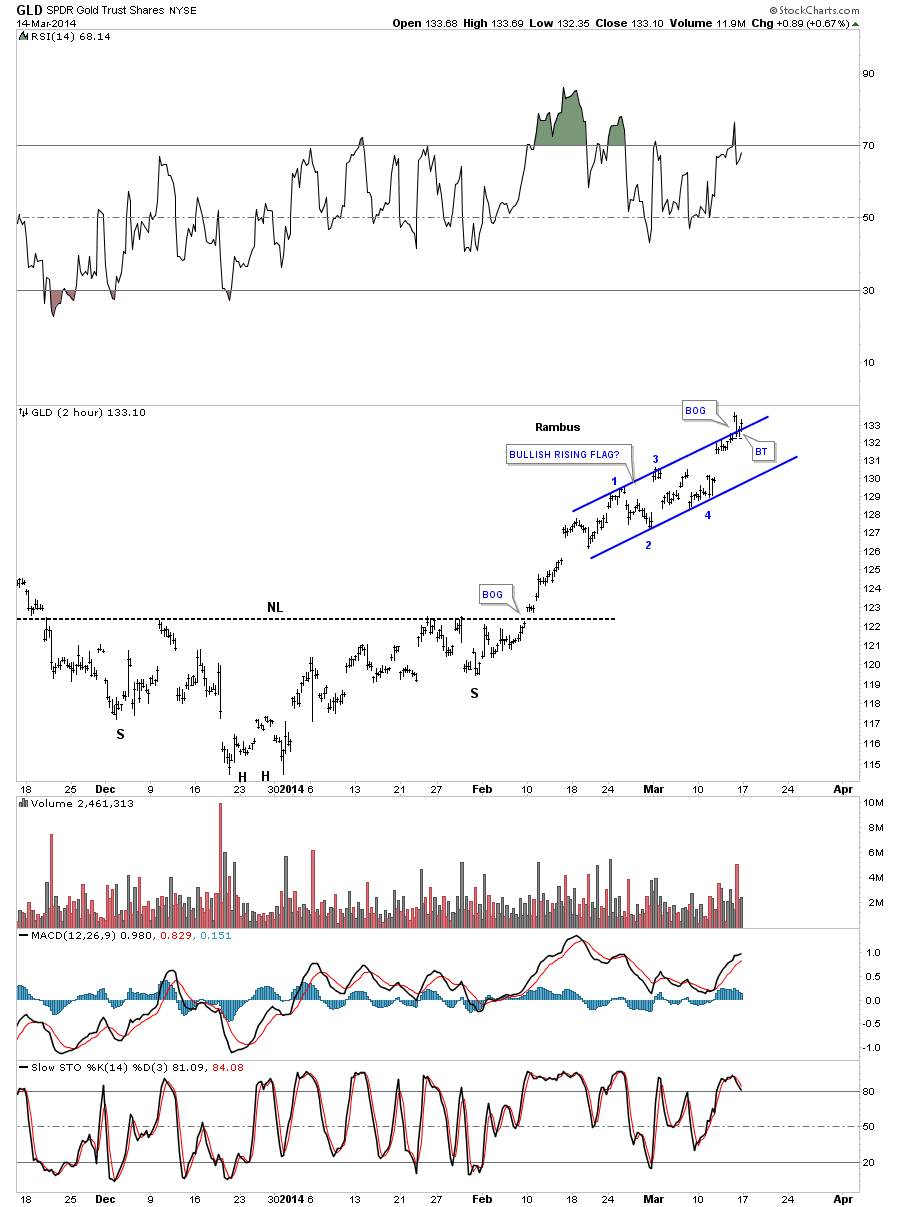
Below is a 2 hour, 4 month chart for GLD that looks totally different from the SLV chart. They are different but similar if you look at the base or reversal patterns and the consolidation patterns. Here you can see GLD formed an inverse H&S bottom as its reversal pattern. As we all know, gold has been stronger than silver so we should look for a strong consolidation pattern. The strongest consolidation pattern that I know of, and nobody recognizes it, is a consolidation pattern that points in the same direction as the trend. As you can see on the SLV chart above, the bull flag slopes down against the uptrend. This is what a normal consolidation pattern looks like. When a stock is in a very strong trend it will slope with the trend instead of against it.
Friday, GLD gapped above the top rail of it bullish rising flag consolidation pattern and did its backtest just as SLV did.

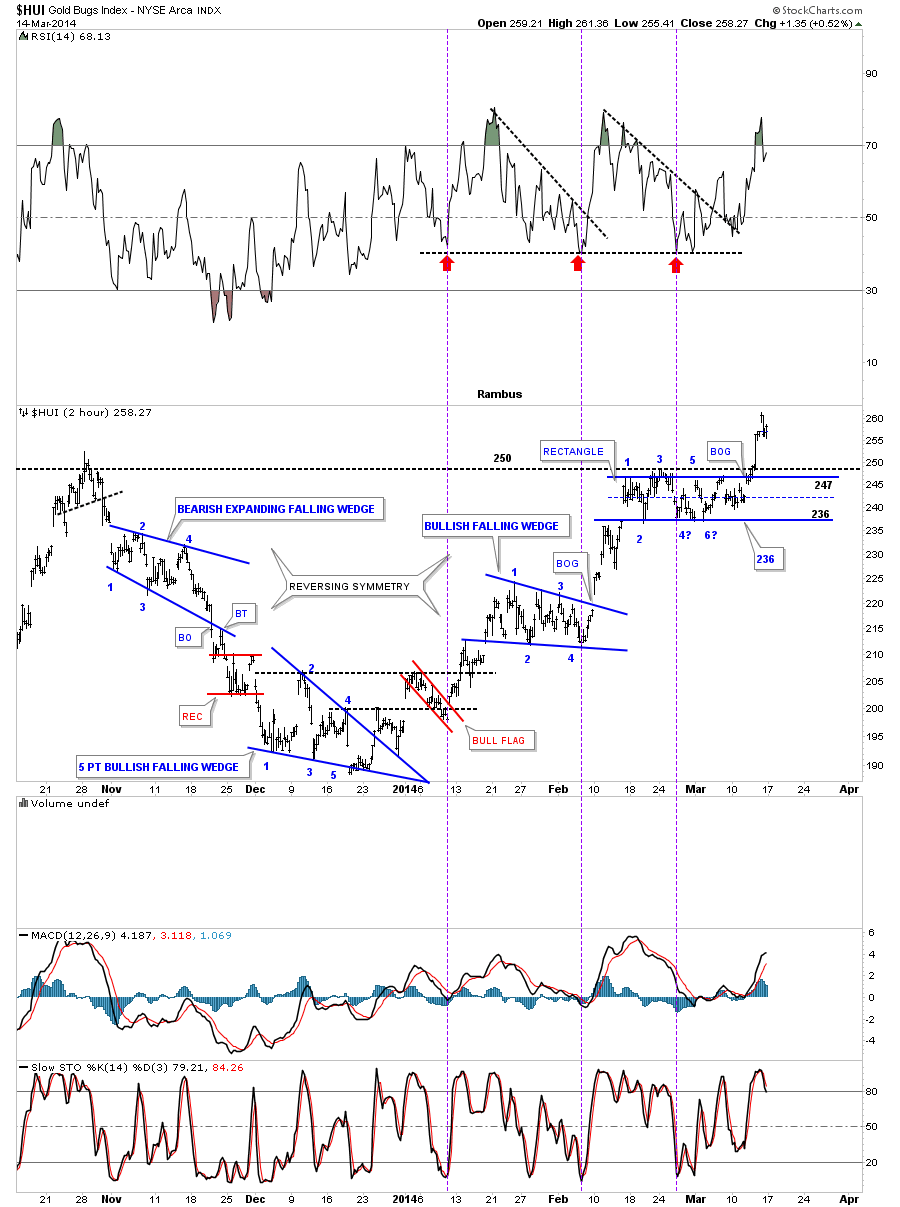
Below is a 2 hour, 5 month chart for the HUI. The last time I showed you this chart we were looking for the 6th reversal point as shown by the 6 with a question mark. As you can see, the HUI rallied back up to the top blue rail and declined back down about half the length of the rectangle where it found support. That’s all the strength the bears had left so the bulls wasted little time in taking control of the situation. The bears are exhausted and need a new area to defend. The bulls gapped out of the rectangle and are now above horizontal resistance.
Folks, from a Chartology perspective, it just doesn’t get any prettier. At some point we’re going to see a consolidation pattern form that will be much bigger than these little ones that have built out so far.
If you recall, I mentioned how we were reversing symmetry backup vs how we came down. With more time on this chart now you can begin to see the reverse symmetry taking hold as this rally progresses. I’ve labeled all the reversal points so you can see the battle that goes on between the bulls and the bears. Each reversal point is a skirmish and when the consolidation pattern finally breaks, to the victor goes the spoils. You can see the bears were in control on the way down but since the blue 5 point, bullish falling wedge reversal pattern broke to the upside, the bulls are now in control.

Weekly comparison chart:

In my humble opinion you can spend every waking minute trying to figure out why gold and the other PM stocks are going up. Is it because of inflation, deflation, copper, the stock markets, currencies, war or a hundred different reasons? If you just follow the price action and devote the time spent trying to find a reason for why, you will be way ahead of the game.
You don’t have to know the answer to the question everybody is trying to answer. It’s irrelevant. The answer is right there in front of you if you take the time to understand what the chart is telling you.
Disclaimer: IMPORTANT RISK DISCLOSURE - This site has been prepared solely for information purposes, and is not an offer to buy or sell or a solicitation of an offer to buy or sell any security or instrument or to participate in any particular trading strategy. The information presented in this site is for general information purposes only. Although every attempt has been made to assure accuracy, we assume no responsibility for errors or omissions. Examples are provided for illustrative purposes only and should not be construed as investment advice or strategy. The information presented herein has not been designed to meet the rigorous standards set by the Commodity Futures Trading Commission for disclosure statements concerning the risks involved in trading futures or options on futures. That disclosure statement must be provided to you by your broker. The materials in this site do not attempt to describe the risks to investors that may be associated with the way trading is conducted in any particular options market or in any market for an underlying or related interest. In the preparation of this site, every effort has been made to offer the most current, correct and clearly expressed information possible. Nonetheless, inadvertent errors can occur and applicable laws, rules, and regulations often change. Further, the information contained herein is intended to afford general guidelines on matters of interest, and to serve solely as an introduction to our financial services. Accordingly, the information in this site is not intended to serve as legal, accounting, or tax advice. Users are encouraged to consult with professional advisors for advice concerning specific matters before making any decision impacting on these matters. This site disclaims any responsibility for losses incurred for market positions taken by members or clients in their individual cases, or for any misunderstanding on the part of any users of this website. This site shall not be liable for any indirect incidental, special or consequential damages, and in no event will this site be held liable for any of the products or services offered through this website. By accessing or otherwise using this website, you are deemed to have read, understood and accepted this disclaimer.