The investing public tends to place a great deal of faith in the forecasts of economists. To be frank, I am not entirely sure why. An overwhelming majority missed the impact that well-documented declines in real estate were having on the economy in 2007.
Here in 2014, the latest housing data may be showing cracks as well. For example, the National Association of Home Builders (NAHB) puts out a monthly housing market index. In February, the index plummeted to 46, then experienced an underwhelming rebound to 47 in March. Members lack enthusiasm for building conditions whenever the index is below 50. Many economists have dismissed the sour sentiment on the basis of extremely poor weather. However, these are builder expectations about future sales. Wouldn’t shifts in the moods of executives be tied more to people’s desire and ability to purchase properties than to seasonal affective disorder?
Data on the actual number of homes being built back up the gloom expressed in the sentiment readings. Housing starts over the first two months of the year are running at a 10% slower pace than the fourth quarter of 2013. Again, the weather is undoubtedly a factor. Yet regions without bad weather also witnessed a dip in the number of projects started.
Remember, most economists had talked about the economy accelerating in 2014. The fact that this has not genuinely been the case — the fact that we have been decelerating and/or running in place — is being blamed entirely on the ice and snow. The truth? Rising mortgage rates had hurt affordability and the fear of interest rates climbing even higher adversely impacted builders as well as the larger economy.
Here’s the good news. The uncertainty of Federal Reserve tapering combined with a noticeable increase in safety-seeking have pushed interest rates lower. Over the last nine months, the U.S. economy has shown an ability to expand when 10-year Treasuries yield between 2.5% and 3%. On the other hand, if rates move appreciably higher than 3.25%, expect stocks to struggle.
How are some of these aspects playing out on the ETF stage? Here are three trends that I am watching:
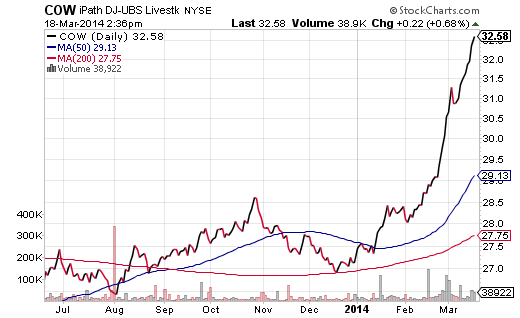
1. Drought. Climate issues are certainly relevant to commodity prices. That said, the lack of rainfall on the west coast is more responsible for the increased cost of meat than polar vortexes on the east coast. The iPath DJ Livestock ETN (COW) is at a 52-week peak due to tight cattle supply after years of drought in California and Texas. Similarly, drought in Brazil, the world’s largest producer of coffee, has sent iPath DJ Coffee Total Return (JO) up as much as 72% year-to-date.
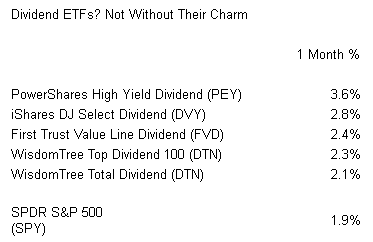
2. Dividends. Yield-sensitive assets (e.g., REITs, bonds, preferred shares, dividend stocks, utility stocks, etc.) often struggled in 2013. In particular, when the 10-year yield roughly doubled from 1.4% to 2.8% during last year’s infamous “taper tantrum,” markets viewed income producers as liabilities. Today, the 10-year’s tight trading range between 2.5% and 3.0% has reignited an appetite for cash flow. Utility stocks are leading the sector charts and dividend ETFs are returning to form. In fact, a variety of dividend funds are outperforming the SPDR S&P 500 Trust (SPY) on a rolling 1-month basis.

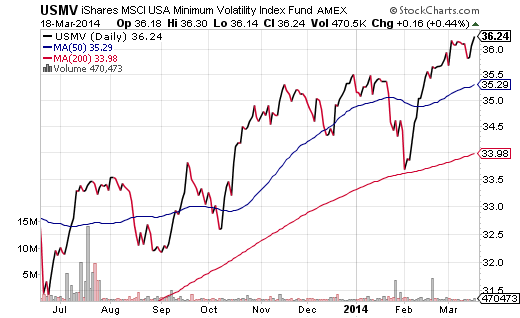
3. Defense. Social media, alternative energy and biotech collectively demonstrate that a risk-on mindset remains. Nevertheless, it is impossible to ignore recent strength in traditionally defensive equities. Recent headliners on the 52-week high list include: PowerShares S&P 500 Low Volatility (SPLV), PowerShares S&P 600 Low Volatility (XSLV), Guggenheim Defensive Equity (DEF) and iShares USA Minimum Volatility (USMV). The latter exists in most client portfolios.
First quarter earnings are likely to disappoint as companies blame the weather for underachievement. At the same time, the Federal Reserve is expected to continue tapering $10 billion from its bond-buying program, adding additional uncertainty in the near-term. These are some of the reasons why I continue to favor non-cyclicals with relative strength like SPDR Select Health Care (XLV) as well as low volatility ETFs like iShares USA Minimum Volatility (USMV).
Disclosure: Gary Gordon, MS, CFP is the president of Pacific Park Financial, Inc., a Registered Investment Adviser with the SEC. Gary Gordon, Pacific Park Financial, Inc, and/or its clients may hold positions in the ETFs, mutual funds, and/or any investment asset mentioned above. The commentary does not constitute individualized investment advice. The opinions offered herein are not personalized recommendations to buy, sell or hold securities. At times, issuers of exchange-traded products compensate Pacific Park Financial, Inc. or its subsidiaries for advertising at the ETF Expert web site. ETF Expert content is created independently of any advertising relationships.


