Investing.com’s stocks of the week
The biotech sector is waking up again and may soon present you with some excellent trading opportunities.
Continue reading to see the charts and swing trade setups of the best biotech ETFs to put on your radar screen now.
iShares NASDAQ Biotechnology ETF (NASDAQ:IBB)
About five years ago, iShares NASDAQ Biotechnology ETF (IBB) kicked off a massive uptrend that lasted 3½ years and led to a 400% gain.
Because of sector strength, many of the most profitable Wagner Daily stock picks during that time were also in the biotech industry.
But even the strongest uptrend doesn’t last forever, and the inevitable correction in IBB began in mid-2015.
The ETF trended lower for a year, found support, and has been stuck in a choppy, sideways range since then.
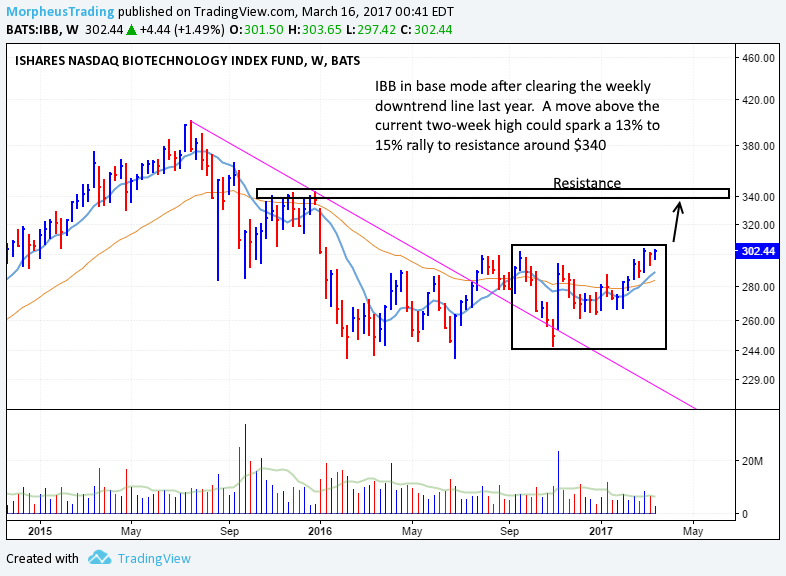
However, that current consolidation pattern has turned into a bullish base that may soon lead to a breakout above the range:

On the chart above, notice the price action of IBB has been tightening up since the start of 2017.
The price is now living above both the 10 and 40-week moving averages, and the 10-week MA just crossed above the 40-week MA (which is now turning up).
These bullish signs indicate that IBB may soon reward astute traders with a breakout that carries it 13-15% higher from here (next resistance is ~$340).
However, be patient because the biotech ETF must convincingly close above its current resistance level (~$304 area) before a valid buy signal is generated.
SPDR S&P Biotech (NYSE:XBI)
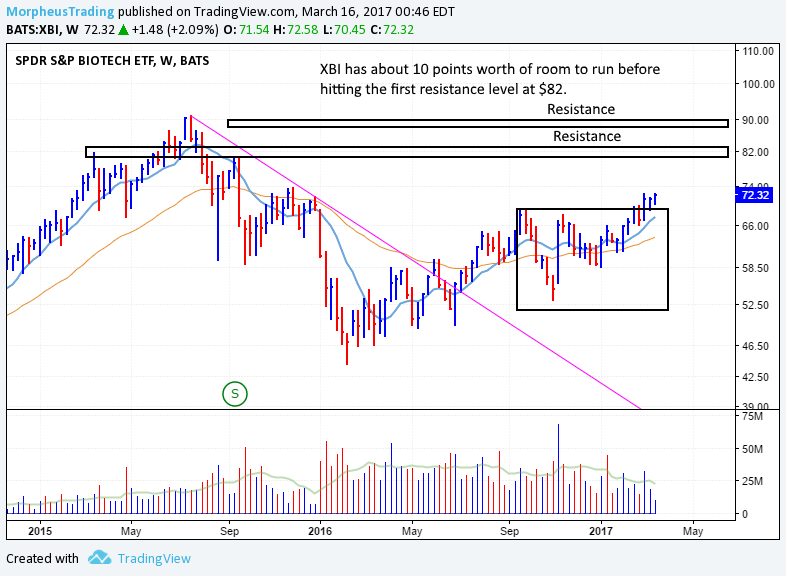
The overall chart pattern of XBI is similar to IBB, but there a few key differences:
- Since its 2016 low, XBI has been trending slightly higher while IBB has been range-bound (means XBI has more relative strength).
- XBI has already moved above resistance of its September 2016 high (although not convincingly).
- XBI is a few percent closer to its all-time high than IBB (less resistance).
Here is the weekly chart of XBI for comparison:

By the way, notice the 10-week MA (teal line) crossed above the 40-week MA (orange line) last September and has held above it the entire time.
That same moving average crossover happened in IBB last September as well, BUT the 10-week MA fell back below the 40-week MA (until two weeks ago).
This subtle difference is another way to confirm the relative strength that $XBI has been showing.
Direxion Daily S&P Biotech Bull 3X Shares (NYSE:LABU)
If you prefer to trade more “caffeinated” ETFs, then the triple leveraged LABU may be the best biotech ETF for you.
Both LABU and XBI track the S&P Biotech Index, but LABU moves in both directions approx. 300% more than the underlying index.
For example, if S&P Biotech Index rallies 1% today, LABU will gain about 3%.
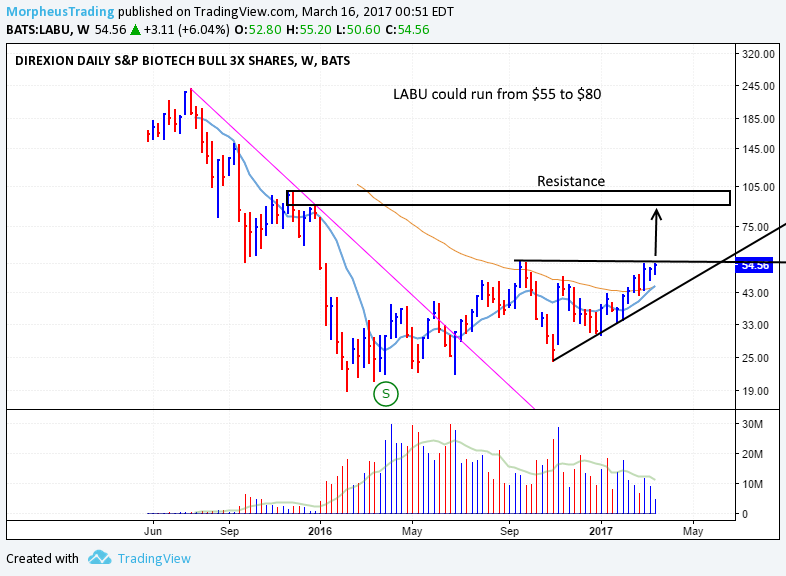
If LABU breaks out above the high of its current range, the 3x leveraged biotech ETF could sprint to the $80 area before running into major resistance:

A rally from $55 to $80 in LABU would equate to roughly a 45% gain, which is obviously more exciting than the 13-15% profit targets in IBB and XBI.
As such, leveraged ETFs can provide an awesome opportunity for traders with small accounts to get maximum “bang for the buck” when trading ETFs.
