- Crypto markets plunged in April, with Bitcoin leading the decline.
- BNB held stronger than others, currently consolidating between $550 and $650.
- Memecoin PEPE corrected after its surge, now eyeing a breakout above $0.000008.
- Invest like the big funds for less than $9 a month with our AI-powered ProPicks stock selection tool. Learn more here>>
Cryptocurrency markets experienced a significant downturn in April, with average losses exceeding 20% across the board, erasing the gains achieved in March. This selling pressure has extended into May, with Bitcoin leading the decline so far.
Bitcoin closed April at $60,672, marking a 14.88% drop for the month. The selloff continued into May, pushing the price as low as $57,000 today. Ethereum, the second-largest cryptocurrency by market cap, suffered even steeper losses, declining by 20% in April. ETH struggled to maintain support around the $2,900 band throughout the month.
BNB, however, exhibited more resilience compared to the broader market, with a decline of only 8% since April. This relative stability can be attributed to the use of BNB collateral in token offerings hosted on the Binance platform. In contrast, the meme coin market, known for its volatility, displayed mixed results as PEPE started May in positive territory after a 24% decline in April.
1. Ethereum: Key Support Needs to Hold
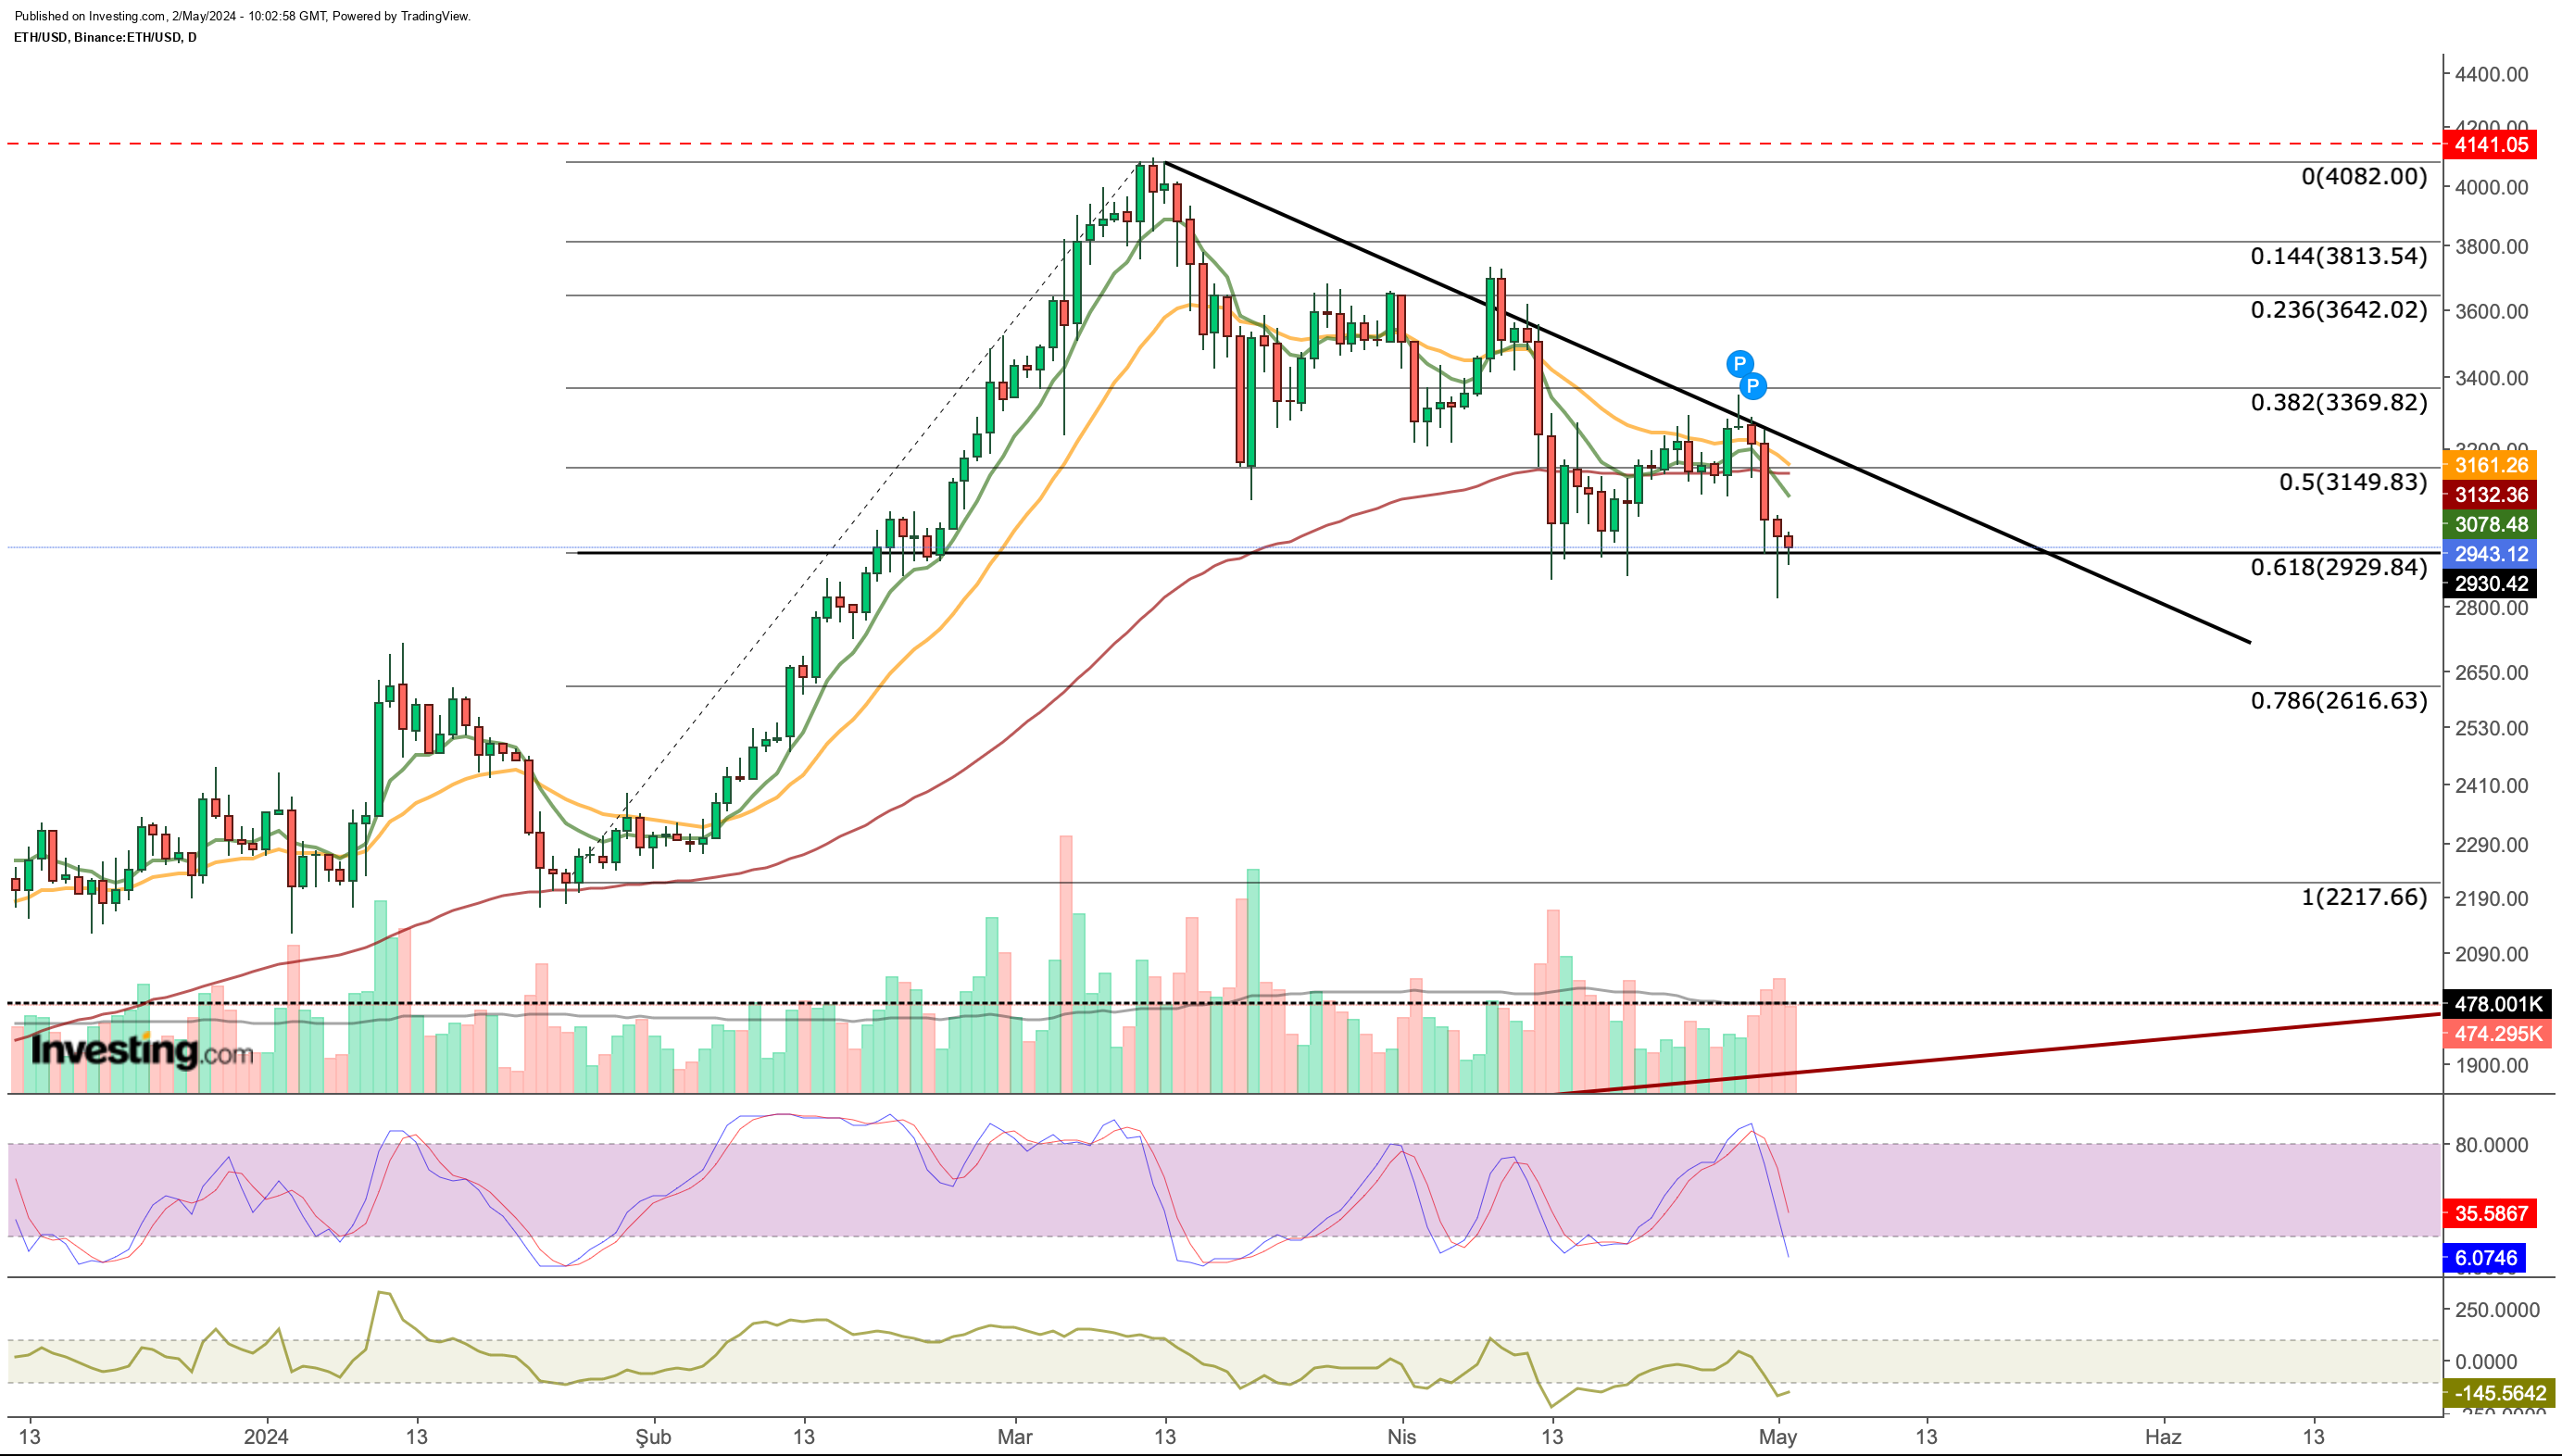
Ethereum attempted a recovery in the second half of April, finding support around $2,920. However, the selling pressure that intensified across the cryptocurrency market this week forced ETH to relinquish its previous gains, bringing the critical $2,900 support level back into focus.

Unable to hold above the $3,150 resistance, ETH retested the Fib 0.618 ideal correction value. During this corrective phase, ETH's meaningful reaction to Fibonacci levels based on the 2024 uptrend highlights the ongoing risk of a decline to $2,600, which aligns with the Fib 0.786 level on a clear daily candle formation below $2,900.
If the $2,900 support holds throughout the week, ETH could potentially revisit the $3,150 resistance. This level coincides with the intersection of fast and slow EMA values, suggesting a potential area of strong resistance technically. Additionally, the falling trend line aligns with this zone, emphasizing the need for a bullish breakout to reverse the current trend.
Should buying pressure pick up in the coming days, surpassing $3,150 would pave the way for the $3,370 levels. During the previous recovery attempt last month, purchases stalled at around $3,300, preventing a breakout.
Positive news flow, particularly regarding potential ETF developments this month, could provide the necessary catalyst for ETH to break through resistance points and target the $3,600 - $3,800 range. Conversely, key technical indicators maintain a bearish bias, suggesting that selling pressure could intensify if ETH falls below $2,900.
2. Binance Coin: Consolidation Phase Could End After March Surge
BNB's rapid upward trajectory since February was interrupted in March by the broader market downturn. However, BNB has shown relative strength compared to the rest of the market. This resilience can be attributed, in part, to the use of BNB as collateral in token offerings on the Binance Launchpool platform.

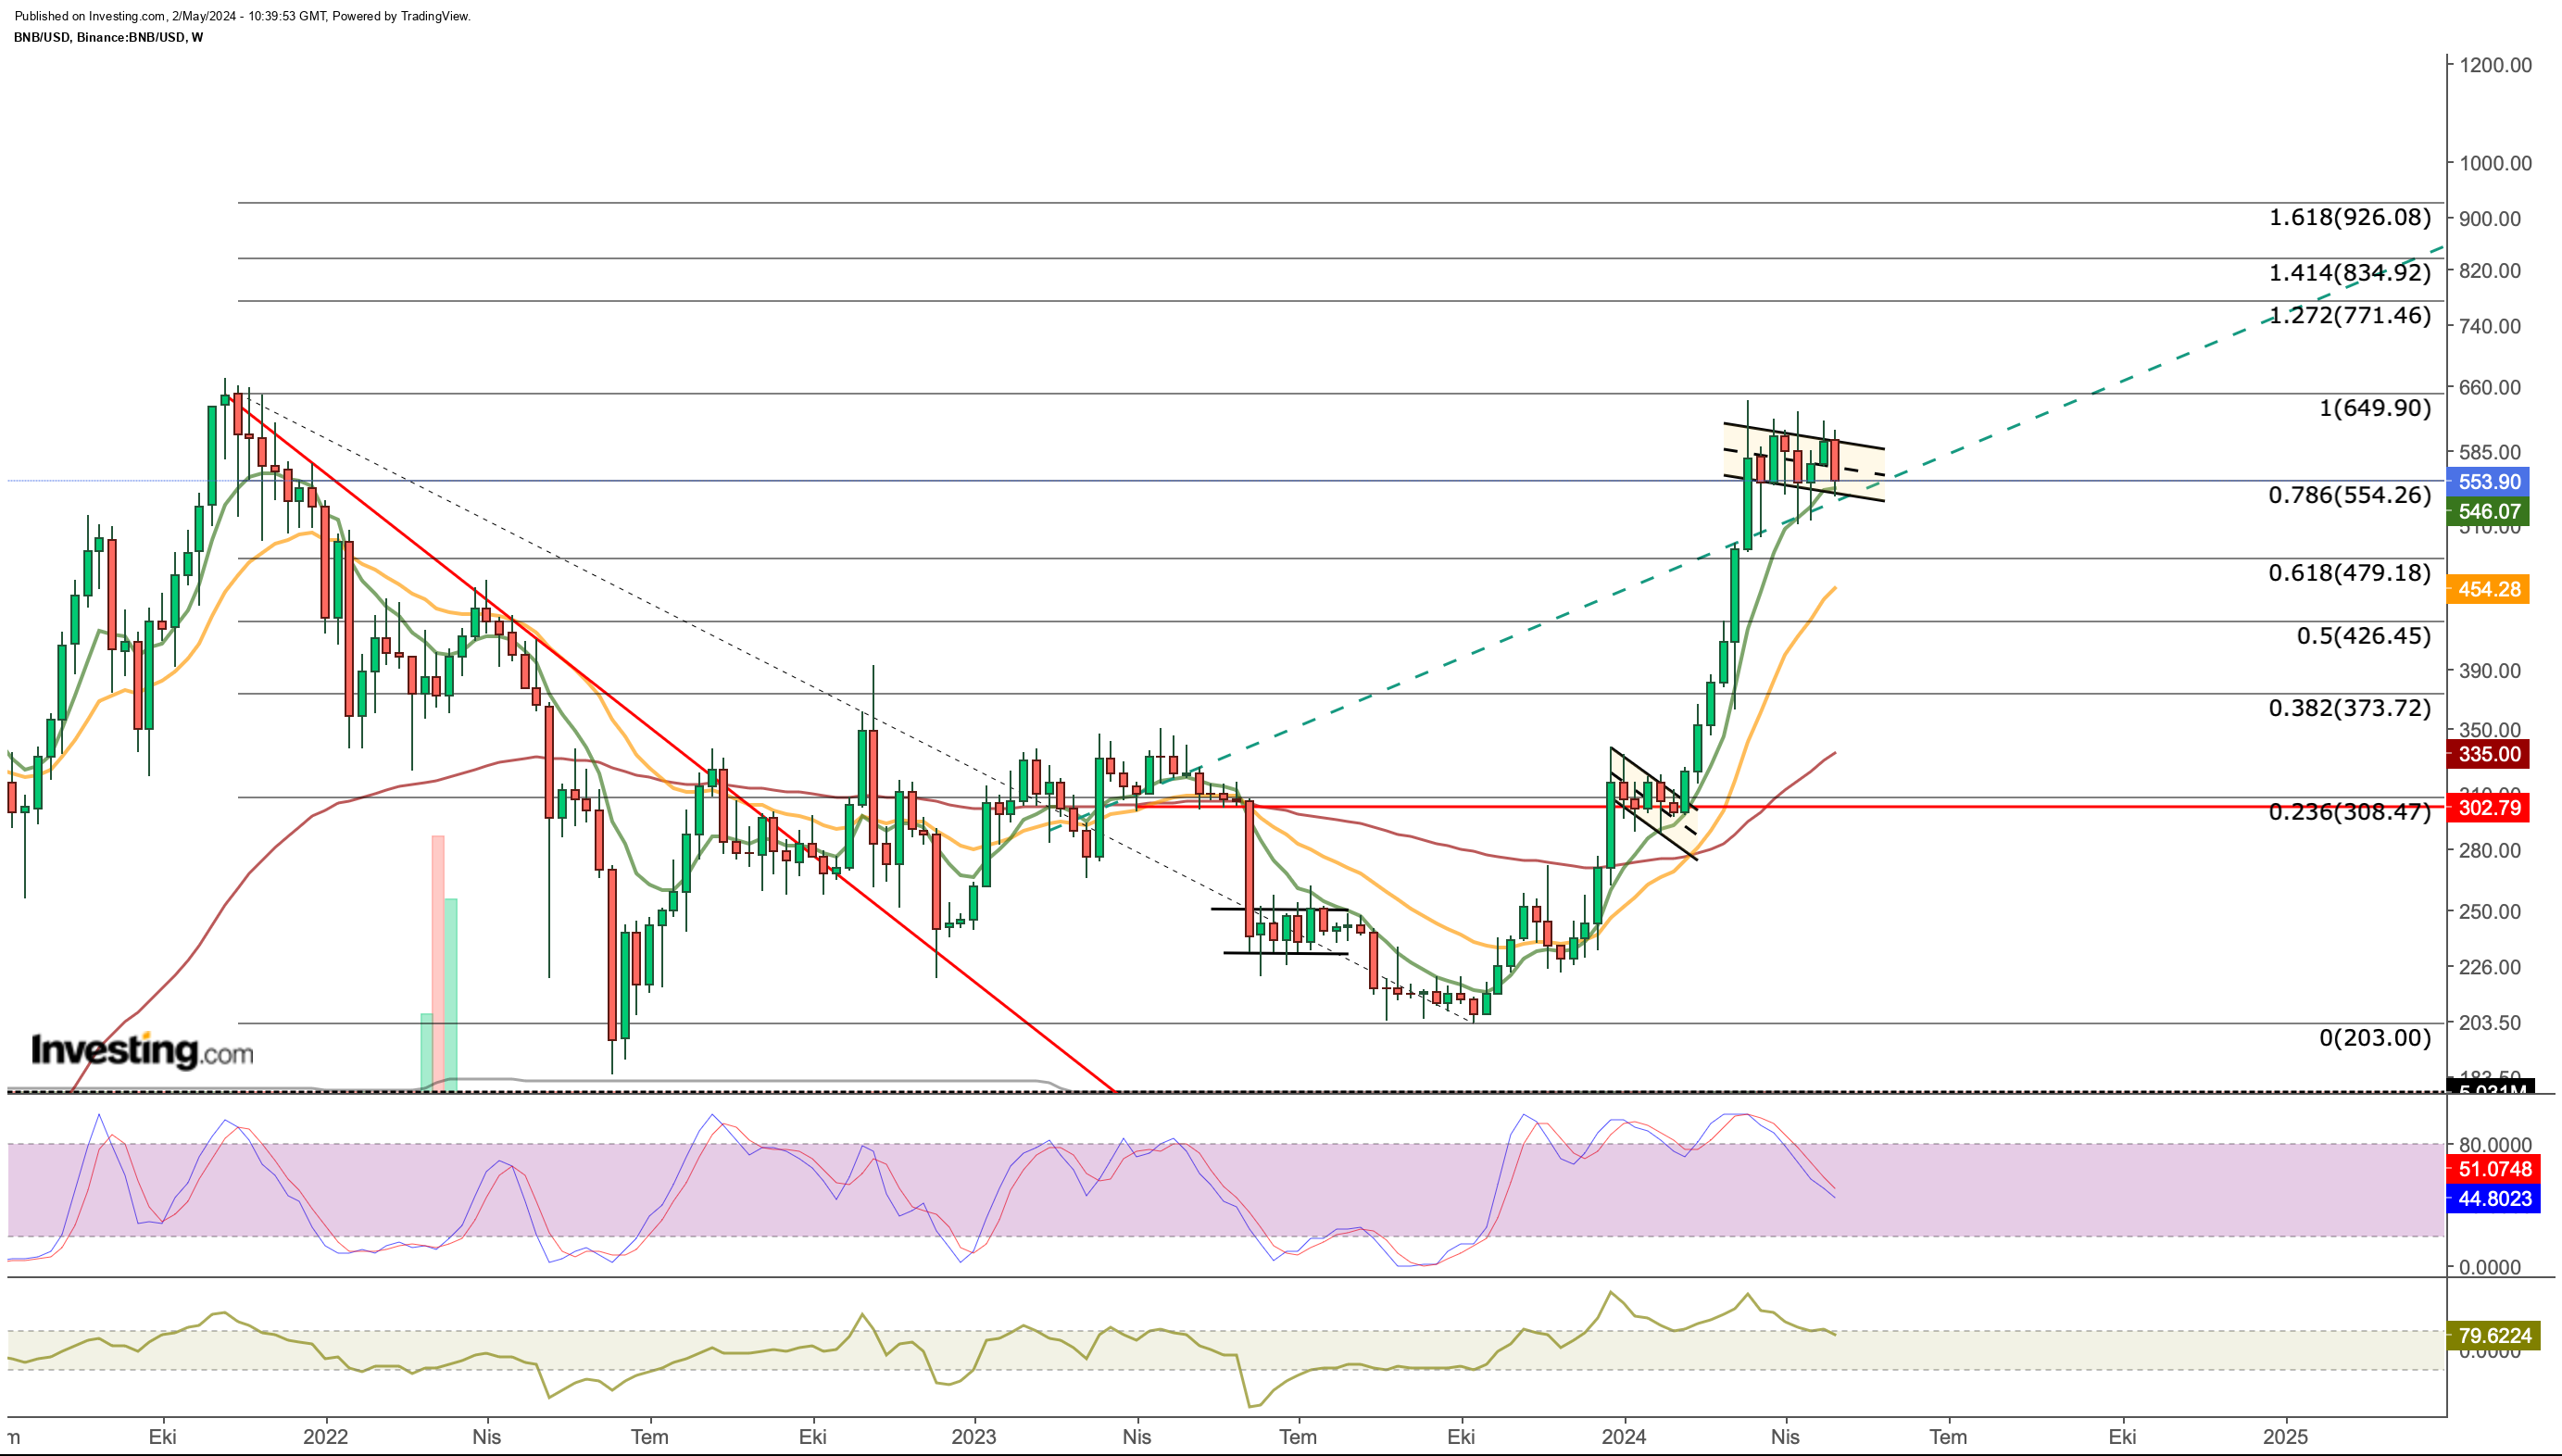
Examining the long-term BNB chart, we observe that the cryptocurrency has swiftly surpassed resistance zones since bottoming out in October 2023. Currently, BNB is consolidating between $550 (corresponding to the 0.768 Fibonacci retracement level) and the 2021 peak of $650.
While there have been brief dips below $550 support since March, there haven't been any weekly closes below this level. This has helped BNB maintain its overall bullish trend, further supported by the 8-week exponential moving average. A weekly close below $550 could trigger a correction toward the $480 zone in the short term.
On the upside, an intermediate resistance level exists around $605. If buying pressure pushes BNB to a weekly close above $605, it could potentially lead to a surge towards $770 after surpassing the previous peak of $650.
Interestingly, BNB entered a similar consolidation phase in January, followed by a sharp upward move once the breakout was confirmed. Given the current consolidation pattern, it's likely that BNB's next move will be heavily influenced by its exit point from the short-term channel.
3. PEPE: Key Support Levels to Watch for Rebound
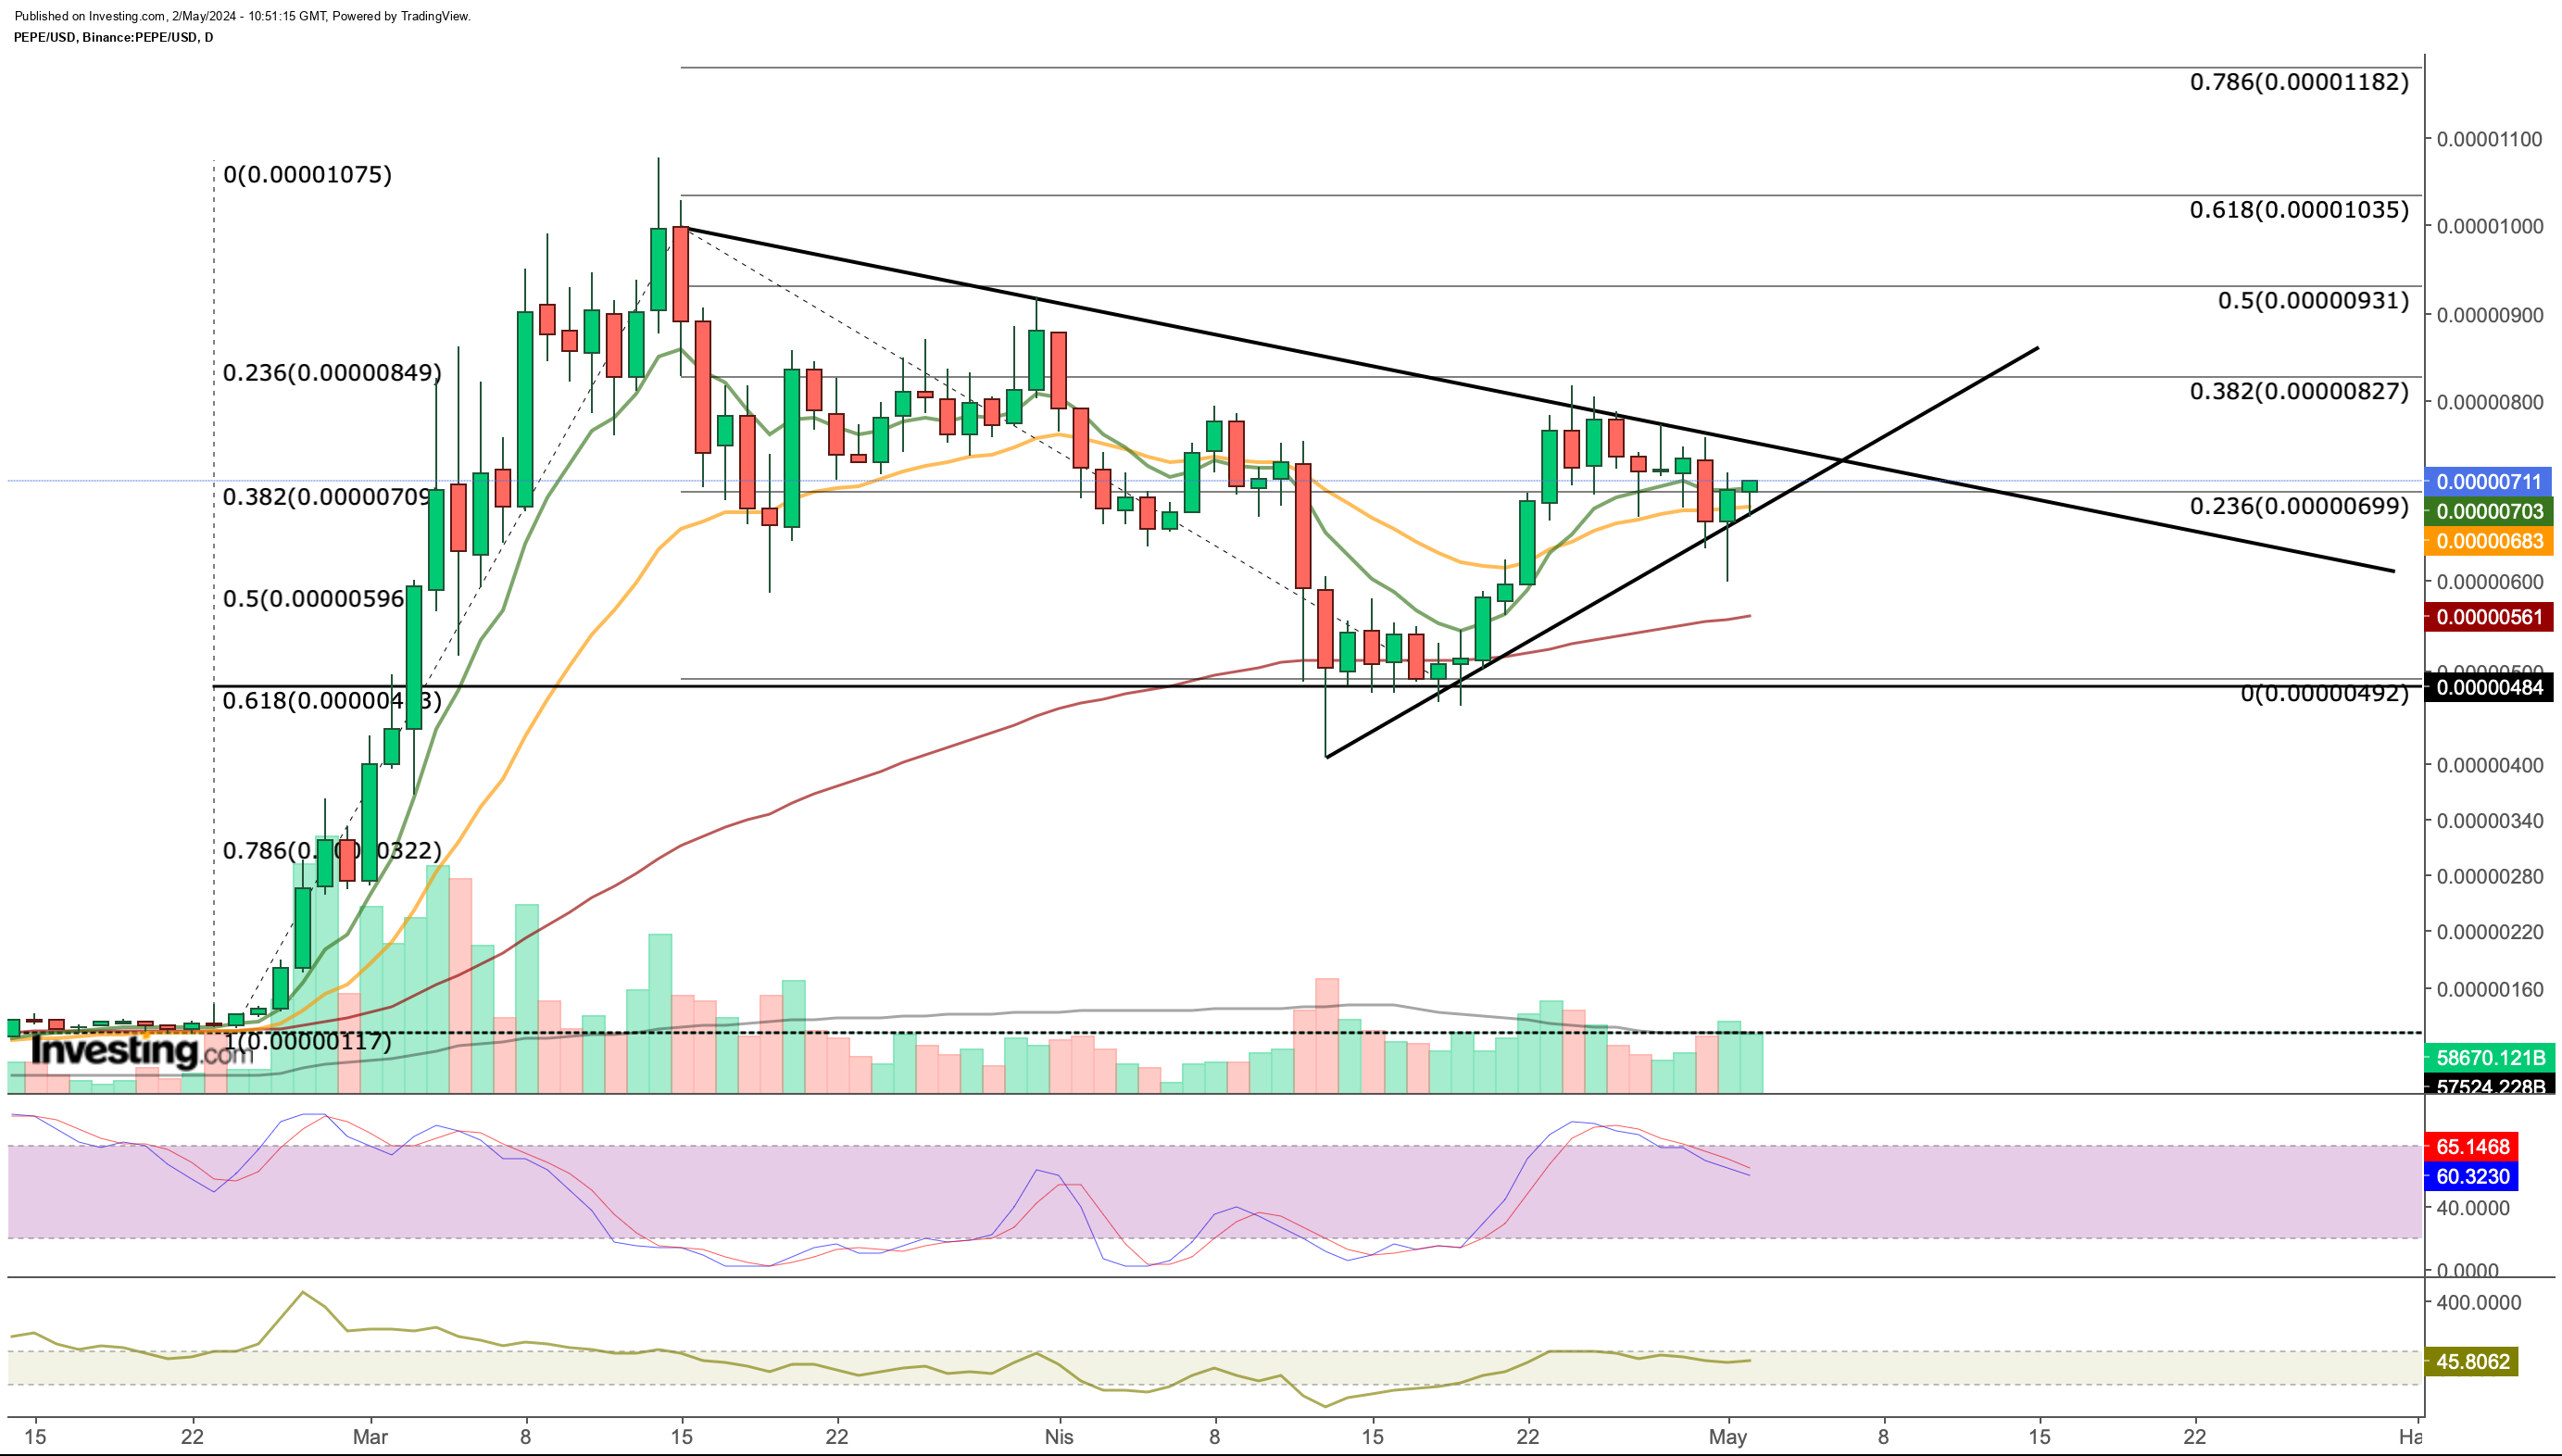
Following a rapid increase in February and March, PEPE/USD entered a correction phase starting from the second half of March. The cryptocurrency found support at an average price of $0.00000492, suggesting a healthy correction aligned with the Fibonacci retracement level of 0.618.

In April, PEPE attempted to break the short-term downtrend line while finding support around the $0.000007 zone. Ideally, a move above $0.000008 would signal an exit from the correction phase. Daily closes above $0.00000830 within this zone could lead to further recovery towards the $0.00001 - $0.000011 range.
Conversely, daily closes below $0.000006 could trigger a decline to the $0.00000560 support level. Weekly closes below this level raise the possibility of a more significant drop.
***
Take your investing game to the next level in 2024 with ProPicks
Institutions and billionaire investors worldwide are already well ahead of the game when it comes to AI-powered investing, extensively using, customizing, and developing it to bulk up their returns and minimize losses.
Now, InvestingPro users can do just the same from the comfort of their own homes with our new flagship AI-powered stock-picking tool: ProPicks.
With our six strategies, including the flagship "Tech Titans," which outperformed the market by a lofty 1,745% over the last decade, investors have the best selection of stocks in the market at the tip of their fingers every month.
Subscribe here and never miss a bull market again!
Disclaimer: This content, which is prepared purely for educational purposes, cannot be considered as investment advice. We also do not provide investment advisory services.

