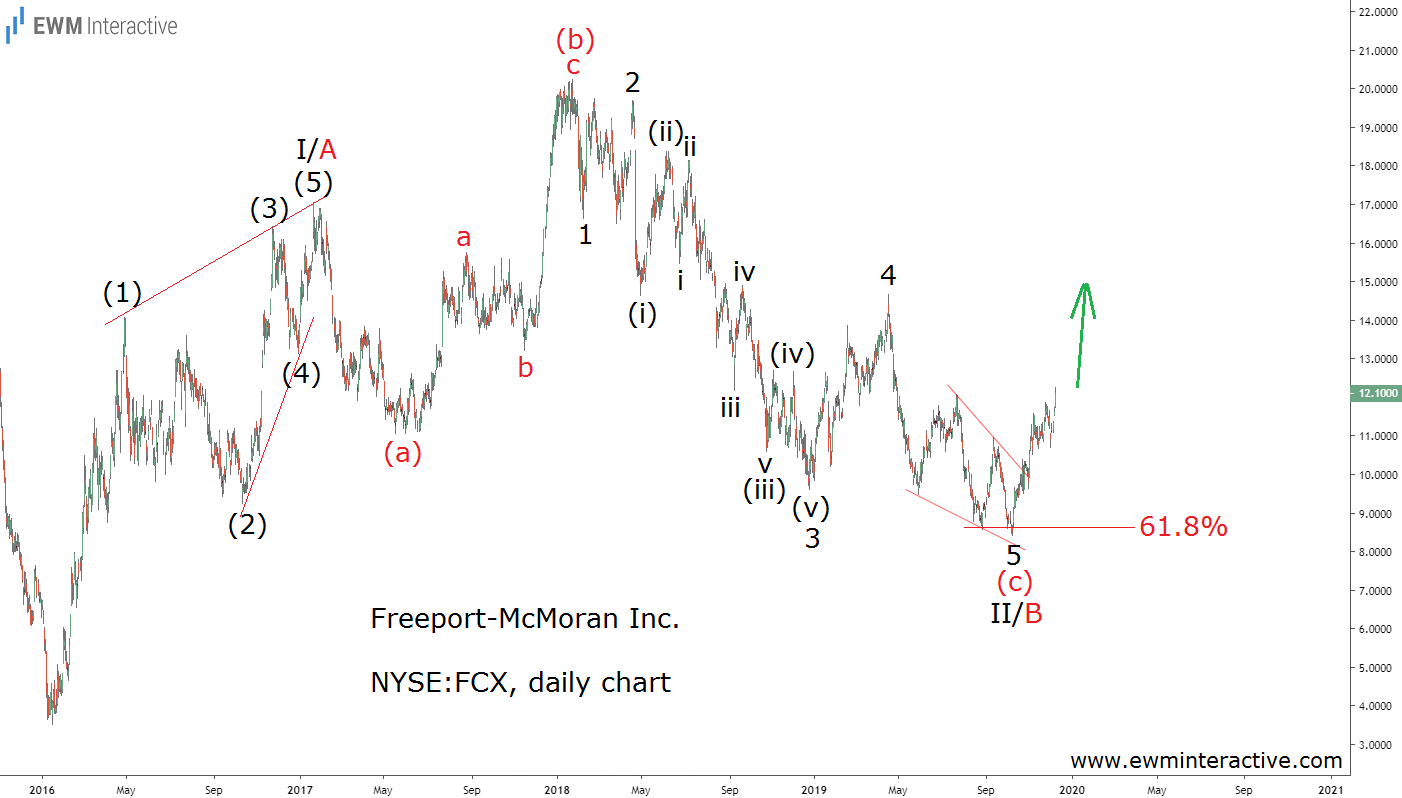
It’s been a rough couple of years for U.S.-based copper miner Freeport-McMoran (NYSE:FCX). The stock reached $20.25 a share in the first month of 2018. Now, in the last month of 2019, FCX is hovering around $12.10. Despite the significant recovery from as low as $8.43 in October, the stock is still down 40% since January 2018.
Can the recent two-month rally be trusted or is it just another short-lived recovery within the larger downtrend? With that question in mind, let’s put the daily chart of Freeport stock in an Elliott Wave context.

The daily chart above reveals the entire wave structure since the bottom at $3.52 in January 2016. It can be seen as a leading diagonal in wave I/A, followed by an (a)-(b)-(c) expanding flat correction in wave II/B. Together, these two parts – motive and corrective – form a complete 5-3 Elliott Wave cycle.
Freeport Stock Looks Promising Heading into 2020
Wave I/A ended at $17.06 in January 2017. Wave II/B occupies the rest of the chart as it took nearly three years to develop. The initial decline to $11.05 in wave (a) was followed by a simple a-b-c zigzag to a new high in wave (b). Wave (c) was a five-wave impulse, labeled 1-2-3-4-5, where wave 5 is an ending diagonal.
If this count is correct, the current recovery must be the beginning of wave III/C, which should be able to reach $21 and beyond. Another reason for optimism is the fact that wave (c) of II/B seems to have terminated shortly after touching the 61.8% Fibonacci level. All told, 2020 is shaping up to be a better year for Freeport-McMoran investors.
