2016 Market Pessimism:
And exhale!
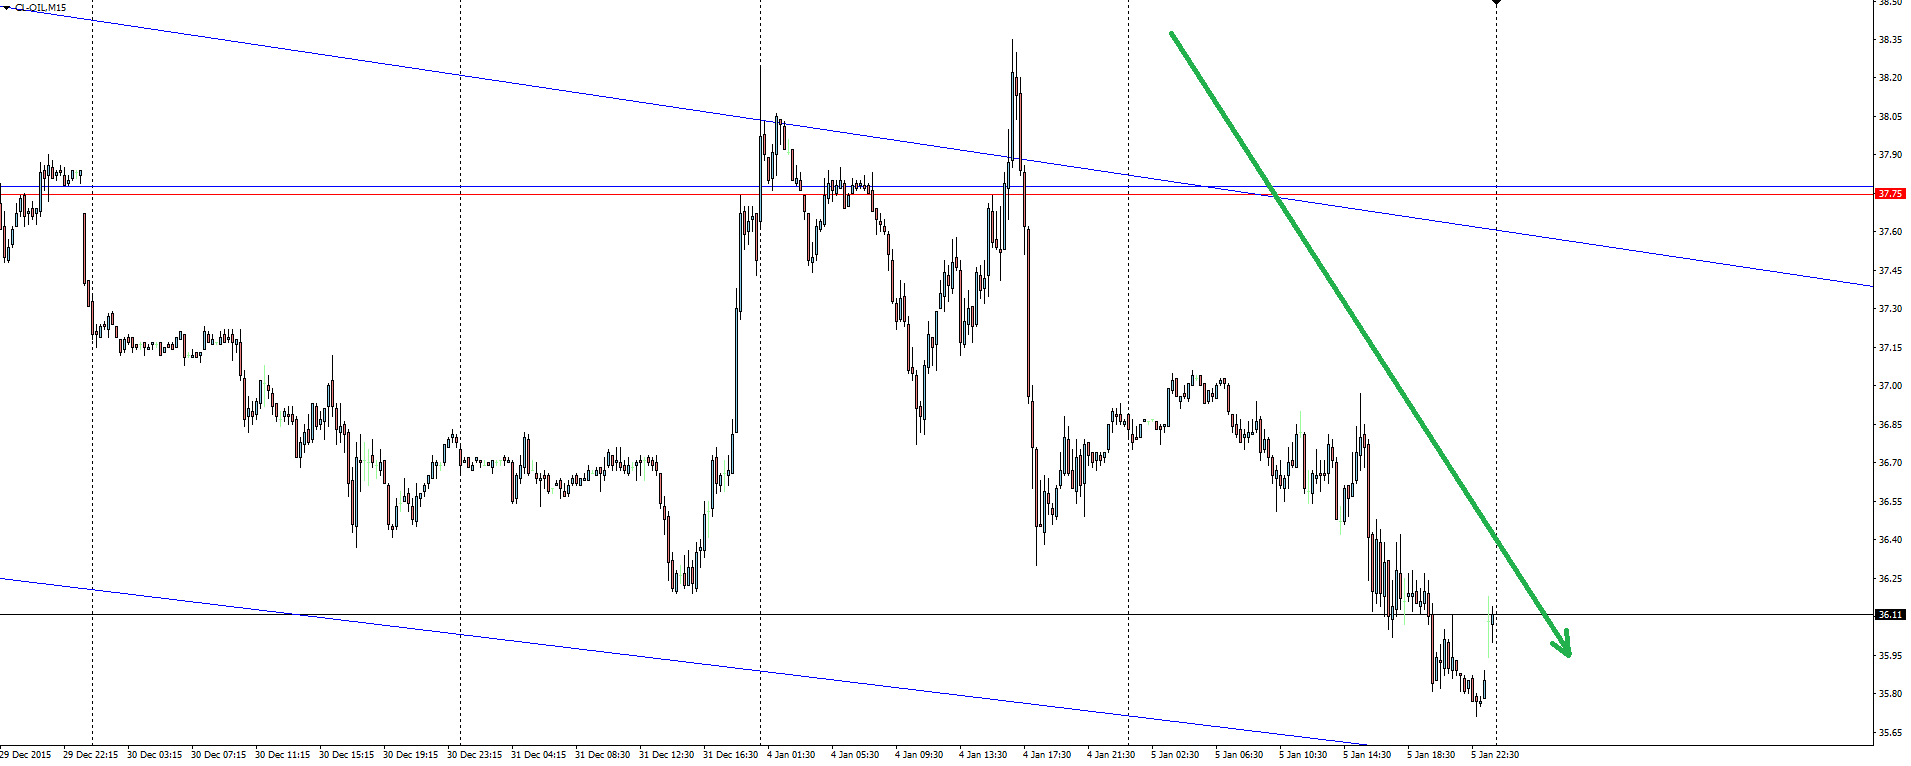
We’ve only had two full trading days of 2016 and already the financial world is shrouded in pessimism. Monday’s feature story was the dramatic flare-up in tensions between Saudi Arabia and Iran after sectarian issues threatened to send oil sky-rocketing.
Crude Oil 15 Minute:
Click on chart to see a larger view.
Err, not quite.
When two powerhouses lock diplomatic horns in one of the biggest oil producing regions of the world and barely a ripple is sent through global oil markets, clearly things have changed. The oil market isn’t as reliant on the Middle East as it once was and ample supply and mass production of crude elsewhere has seen Middle Eastern geopolitical risks interpreted by markets as the isolated issues that they probably are.
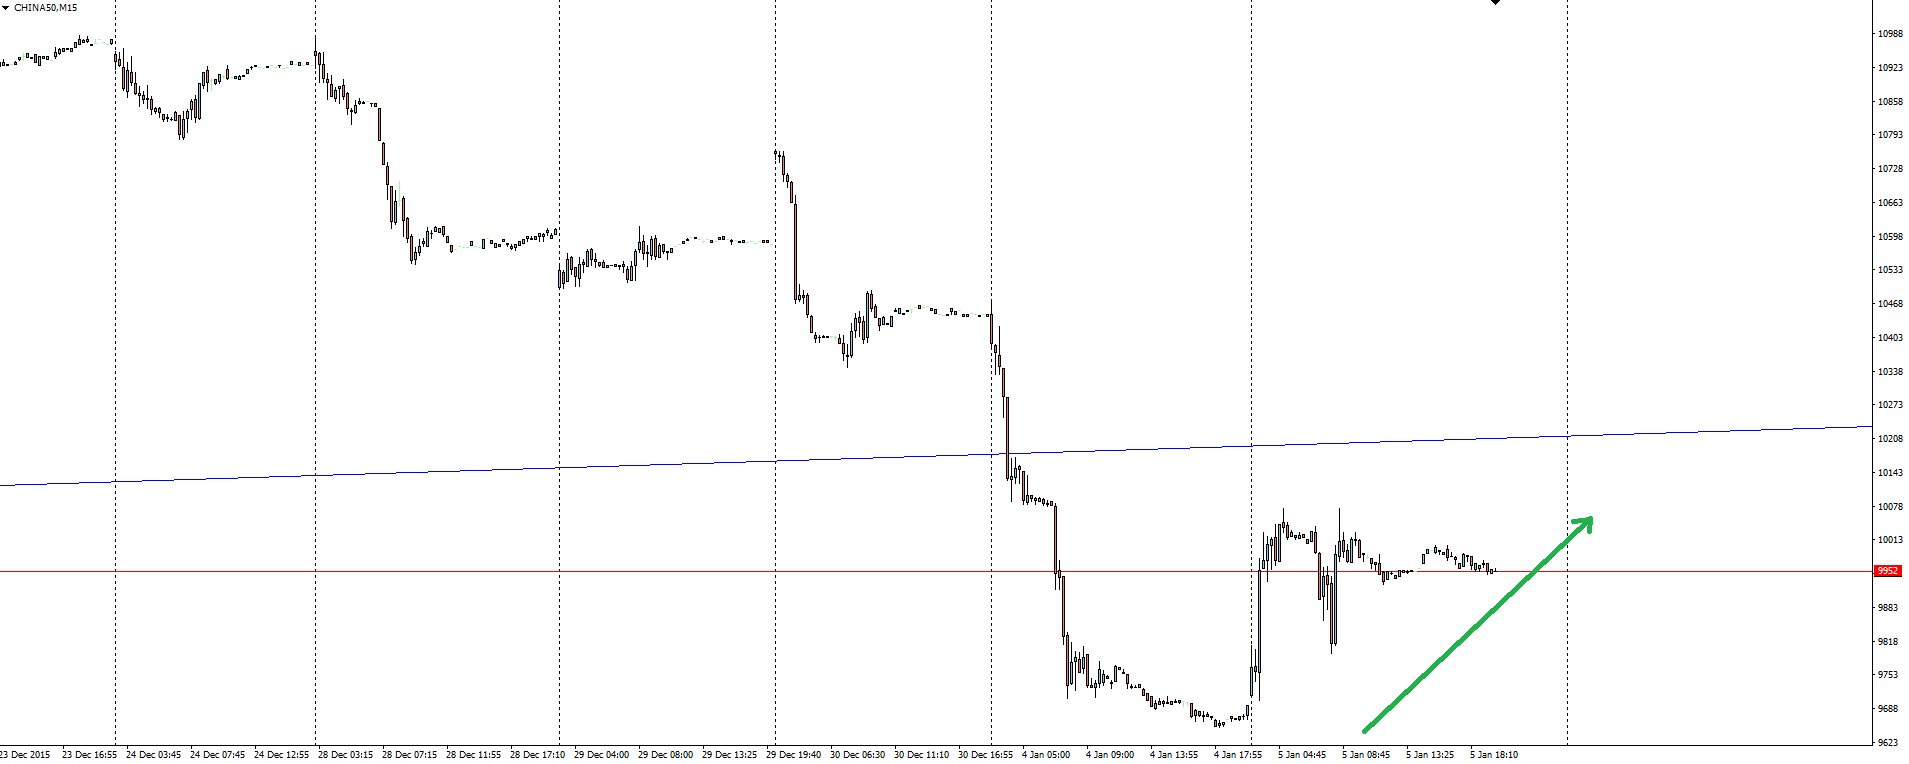
How about the Chinese stock market carnage on the back of deteriorating economic data? Monday’s terrible Caixin Manufacturing PMI saw a circuit breaker hit as the Chinese stock market went limit down and panic set in.
China A50 15 Minute:
Click on chart to see a larger view.
Umm, nope again.
Whether markets quite have the confidence that Chinese economic issues can stay as isolated as political tensions in the Middle East is another issue, but for now the expected panic has evaporated. The fact that stocks managed to stabilise yesterday was greatly helped by the stock market regulator releasing guidelines on what will happen when a short selling ban expires on Friday. The People Bank of China also injected 130 billion yuan into the country’s financial system, propping up the yuan.
The moral of the story here is that things in the world happen and the financial media likes to talk about it. As traders, it is our job to take a step back and try to see things as they really are. Stay safe out there.
Chart of the Day:
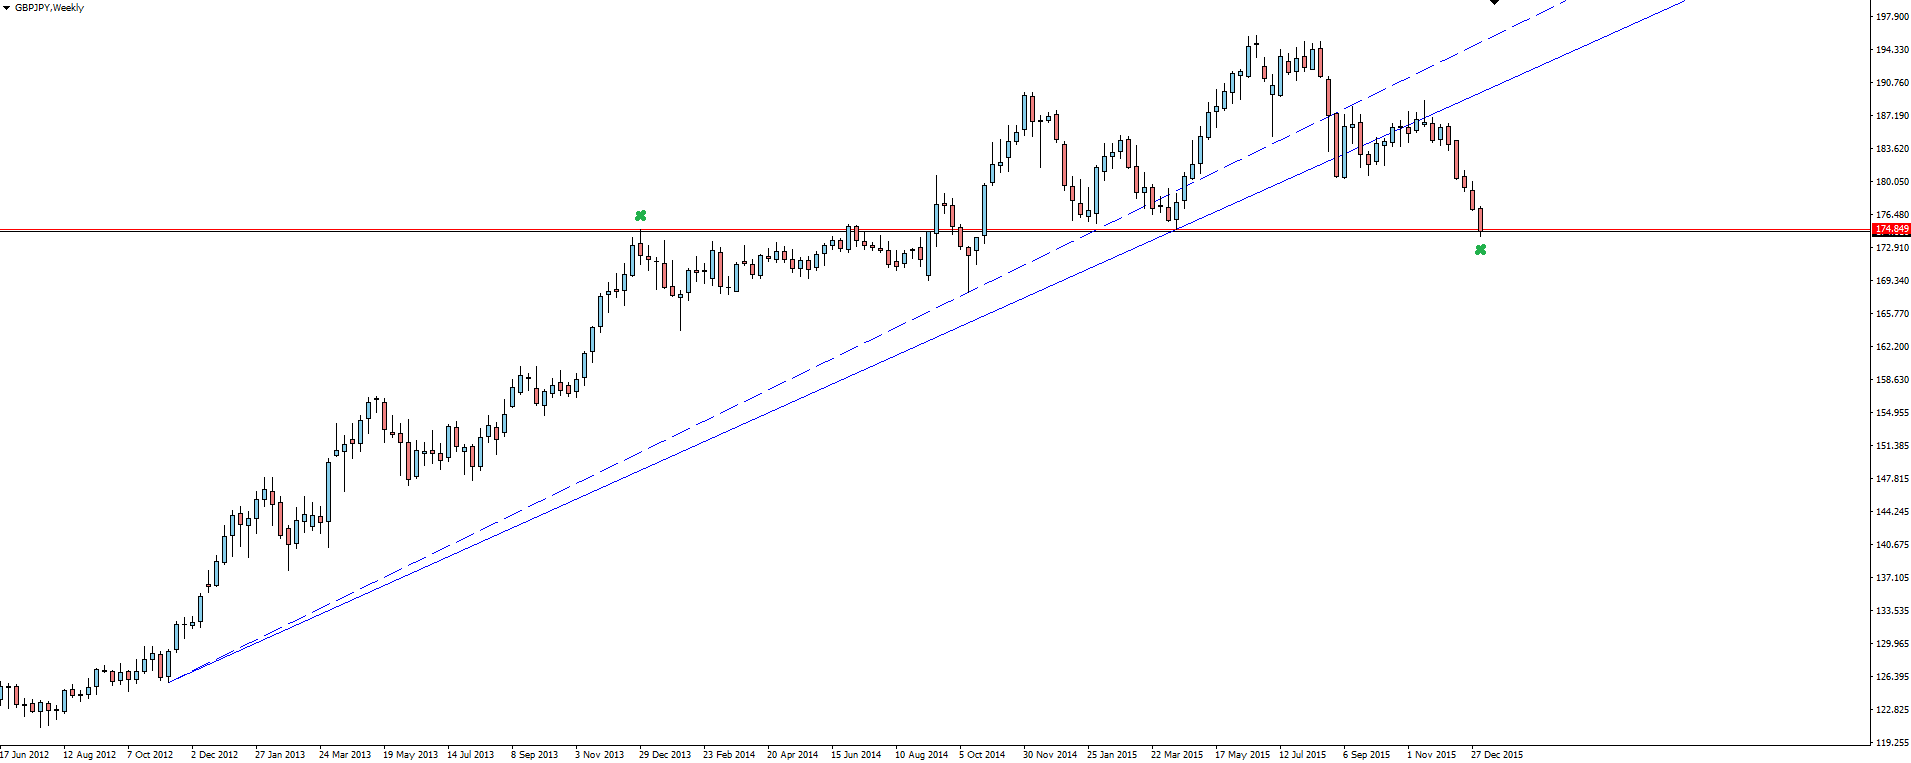
Okay, that’s enough looking at what happened, let’s turn our attention to the future and where some trading opportunities might be. Today’s chart of the day takes a look at one of our favourite currency crosses, pound/yen!
GBP/JPY Weekly:
Click on chart to see a larger view.
Zooming out to the weekly on our GBP/JPY chart, we see the obvious bullish trend broken, retested and a continuation down. It gets interesting here, because this is the first level of major horizontal support that price has encountered since the change in trend. This level has been a key reaction point in the past, with the last huge bullish rip coming off it.
We’ll be watching for a reaction from here.
On the Calendar Wednesday:
NZD GDT Price Index (-1.6% v 1.9% previously)
CNY Caixin Services PMI
EUR Italian Bank Holiday
GBP Services PMI
USD ADP Non-Farm Employment Change
CAD Trade Balance
USD Trade Balance
USD ISM Non-Manufacturing PMI
USD FOMC Meeting Minutes
Risk Disclosure: In addition to the website disclaimer below, the material on this page prepared by regulated Forex broker Vantage FX Pty Ltd does not contain a record of our prices or solicitation to trade. All opinions, news, research, tools, prices or other information is provided as general market commentary and marketing communication – not as investment advice. Consequently any person acting on it does so entirely at their own risk. The experts writers express their personal opinions and will not assume any responsibility whatsoever for the Forex account of the reader. We always aim for maximum accuracy and timeliness, and Australian MT4 broker Vantage FX shall not be liable for any loss or damage, consequential or otherwise, which may arise from the use or reliance on this service and its content, inaccurate information or typos. No representation is being made that any results discussed within the report will be achieved, and past performance is not indicative of future performance.
