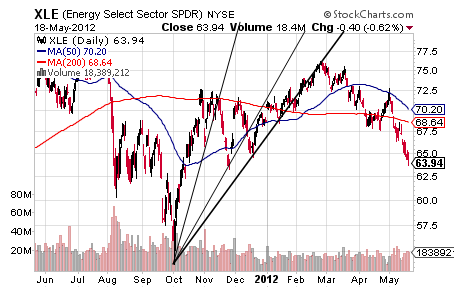
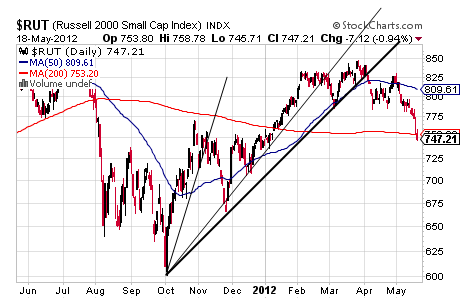
As was noted in May 4’s Spring/Summer Sector Rotation Time?, it was the energy sector that led the current 9% decline in the S&P with an intermediate-term reversal that started early this year and well before the Russell 2000 began to reverse in early March and the broader indices in late March into April. 
This reversal in the XLE is shown by its breach of that third Bear Fan Line followed by the XLE’s bearish cross through its 50 DMA and then a downside slicing of its 200 DMA with the XLE currently 7% below its 200 DMA.
Just today the Russell 2000 followed suit by closing below its 200 DMA on a bearish looking candle and something that the XLB did a few days ago on a truly bad looking chart that is not shown here tonight. 
Ahead of the Russell 2000 and the XLB making the 200 DMA dive, though, were some of the big banks including C, GS and MS with each roughly 15-20% beneath its 200 DMA for a much deeper dive than the one made by the XLE or the XLB.
Assuming that the Russell 2000 continues to follow its bearish predecessors found in XLE, XLB, C, GS and MS, it seems to follow that the Russell 2000 may come to trade 6-20% below its 200 DMA in the weeks ahead to put this small cap index somewhere between 602 and 709 with the former figure of tremendous interest considering it is literally the precise target of its confirming Rising Wedge.
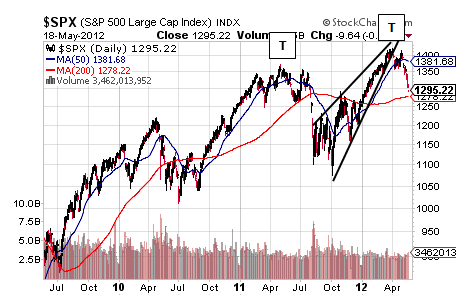
What makes all of this even more interesting is when the S&P is brought into this follow-the-bearish-engine exercise, it suggests that the S&P will be crossing through its 200 DMA at 1278 very soon to drop toward 1200 but that the S&P could drop as low as 1022 and a level not discussed seriously here since summer 2010 and one that is below the 1075 target of the S&P’s bearish Rising Wedge. 
Of course, in the context of the S&P’s newest Double Top pattern with an über-bearish target of 738, 1022 seems like only a small dose of the full correction that is coming and that one that seems very much to have begun.
Supporting the start of a correction that will rival the crash in 2008 is the 200 DMA swan song showing in banks, energy and materials and an economic combination that supports a broad market dive on perhaps another black swan.
- English (UK)
- English (India)
- English (Canada)
- English (Australia)
- English (South Africa)
- English (Philippines)
- English (Nigeria)
- Deutsch
- Español (España)
- Español (México)
- Français
- Italiano
- Nederlands
- Português (Portugal)
- Polski
- Português (Brasil)
- Русский
- Türkçe
- العربية
- Ελληνικά
- Svenska
- Suomi
- עברית
- 日本語
- 한국어
- 简体中文
- 繁體中文
- Bahasa Indonesia
- Bahasa Melayu
- ไทย
- Tiếng Việt
- हिंदी
200 DMA Swan Song Has Started
Published 05/20/2012, 12:45 AM
Updated 07/09/2023, 06:31 AM
200 DMA Swan Song Has Started
Latest comments
Loading next article…
Install Our App
Risk Disclosure: Trading in financial instruments and/or cryptocurrencies involves high risks including the risk of losing some, or all, of your investment amount, and may not be suitable for all investors. Prices of cryptocurrencies are extremely volatile and may be affected by external factors such as financial, regulatory or political events. Trading on margin increases the financial risks.
Before deciding to trade in financial instrument or cryptocurrencies you should be fully informed of the risks and costs associated with trading the financial markets, carefully consider your investment objectives, level of experience, and risk appetite, and seek professional advice where needed.
Fusion Media would like to remind you that the data contained in this website is not necessarily real-time nor accurate. The data and prices on the website are not necessarily provided by any market or exchange, but may be provided by market makers, and so prices may not be accurate and may differ from the actual price at any given market, meaning prices are indicative and not appropriate for trading purposes. Fusion Media and any provider of the data contained in this website will not accept liability for any loss or damage as a result of your trading, or your reliance on the information contained within this website.
It is prohibited to use, store, reproduce, display, modify, transmit or distribute the data contained in this website without the explicit prior written permission of Fusion Media and/or the data provider. All intellectual property rights are reserved by the providers and/or the exchange providing the data contained in this website.
Fusion Media may be compensated by the advertisers that appear on the website, based on your interaction with the advertisements or advertisers.
© 2007-2025 - Fusion Media Limited. All Rights Reserved.
