Summary
The purpose of the Turning Point Newsletter is to look at the long-leading, leading, and coincidental economic indicators to determine if the economic trajectory has changed from expansion to contraction - to see if the economy has reached a "Turning Point."
Takeaway
My recession probability in the next 6-12 months is still 20%. But that is subject to a downward revision of 15% in the next few weeks. Long-leading indicators show no financial market stress, which a now liquidity-sensitive Federal Reserve will further. The primary reason supporting the 20% figure - the inverted yield curve - is improving, while building permits indicate the housing market has returned to expansion. The moving averages of the monthly gains in retail sales are all positive, indicating consumer activity is no longer the lull of the Spring.
I'd like to see the yield curve continue to improve for the next few weeks before lowering the percentage.
Long-Leading Indicators
These indicators are positive:
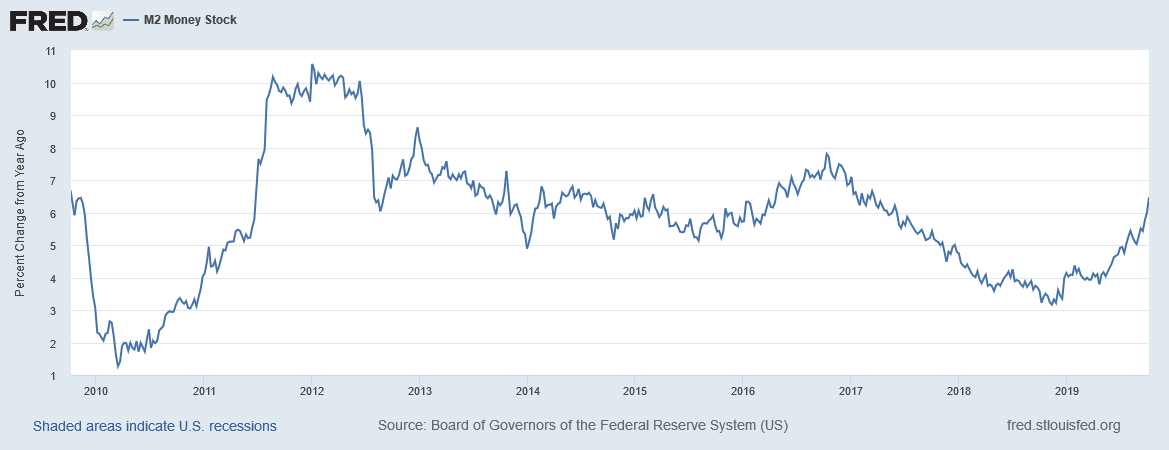
The Federal Reserve has increased the money supply, growing M2 from a pace slightly over 3% to about 6.5% in the latest reading. Part of this is the Fed's response to the money market crunch in the fixed-income markets over the last month.
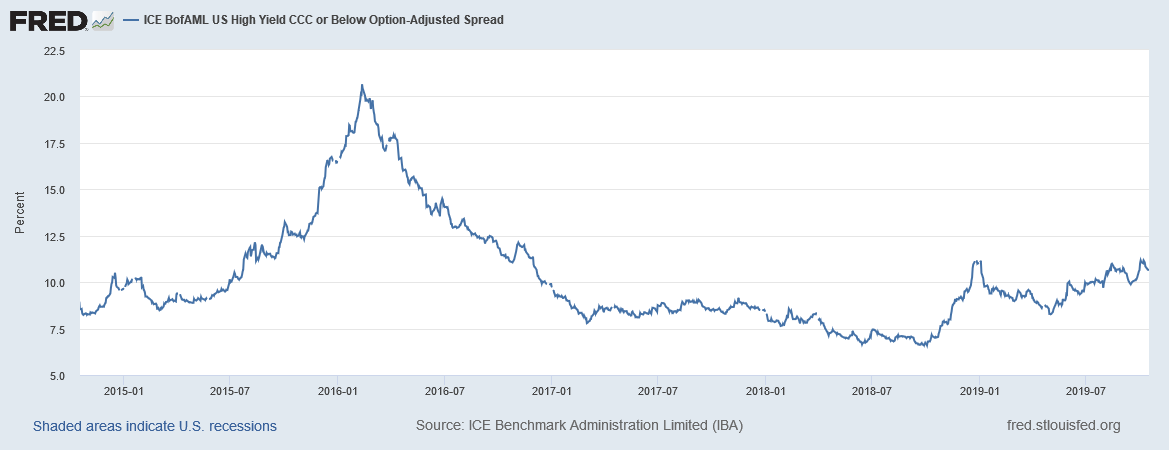
CCC yields - which have drifted higher for the last few months - are still at very respectable levels. The spike in 2016 was caused by the oil market selling-off, which led to a sharp increase in the yields of energy sector debt.
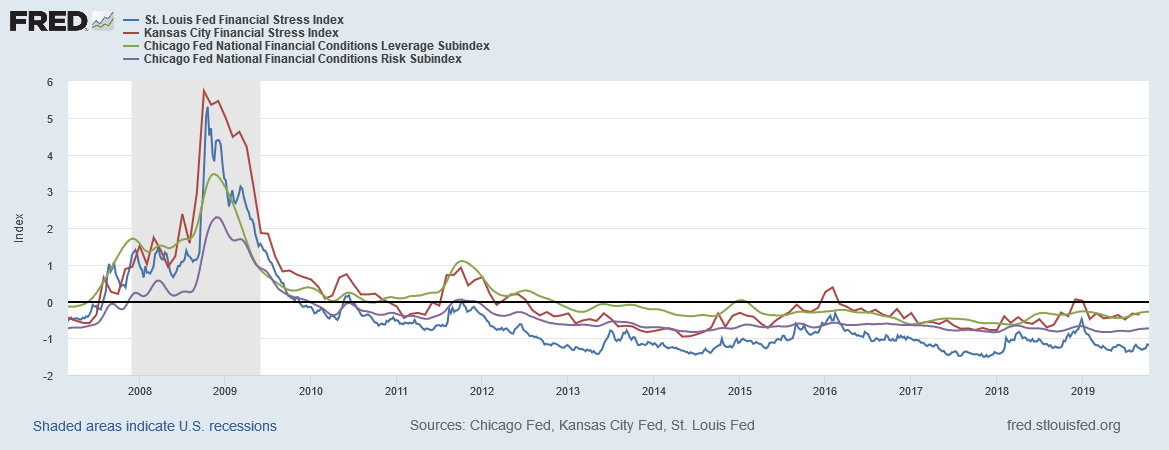
Finally, there is no sign of any stress in the financial system. The chart above contains four measures of financial stress: the St. Louis and Kansas City financial stress indexes, along with the Chicago Fed's leverage and risk indexes. All four are at very low levels.
Leading indicators conclusion: corporate yields are contained, the Fed is increasing the money supply to further lubricate the money market, and the level of stress in the financial system is very low. These are all positive developments.
Leading Indicators
Leading indicators are mostly positive as well.
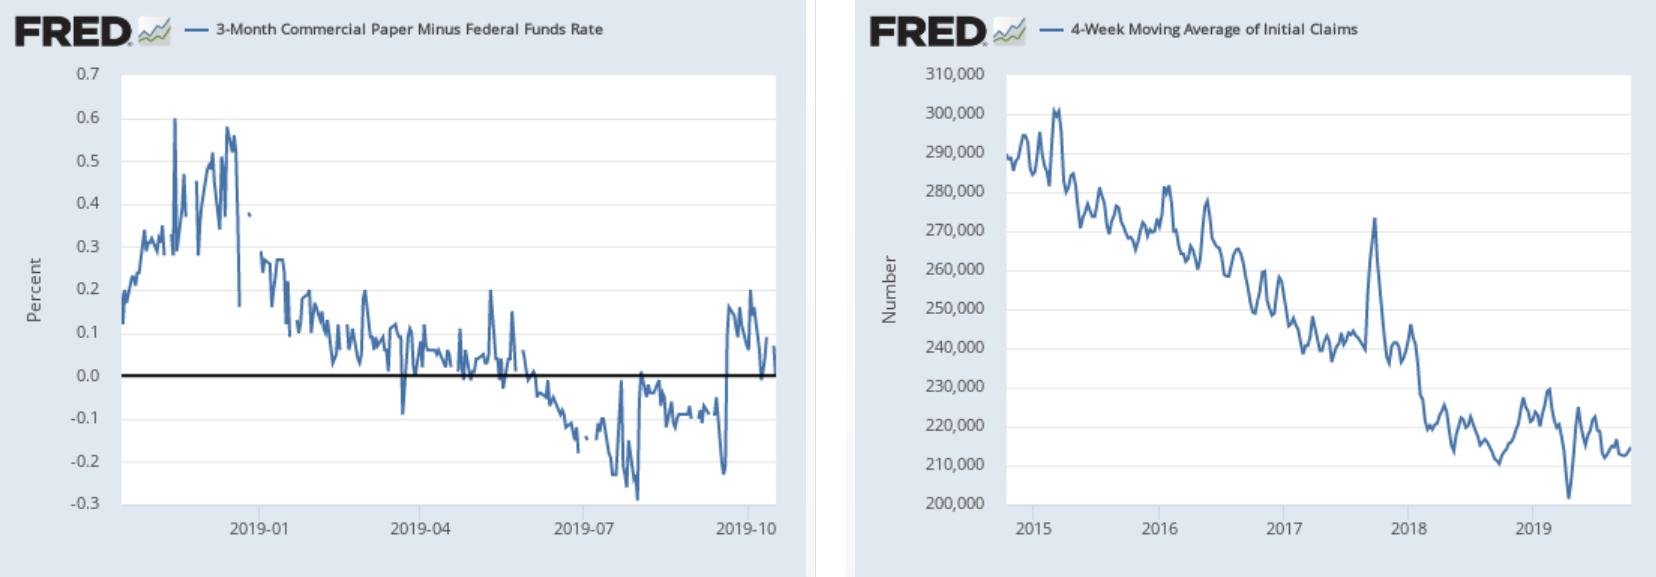
As noted above, the money market experienced heightened stress over the last few months, causing commercial paper rates to spike (left chart). The Fed has responded with several programs. There is no sign of stress in the labor market as shown in the 4-week moving average of initial unemployment claims (right chart).
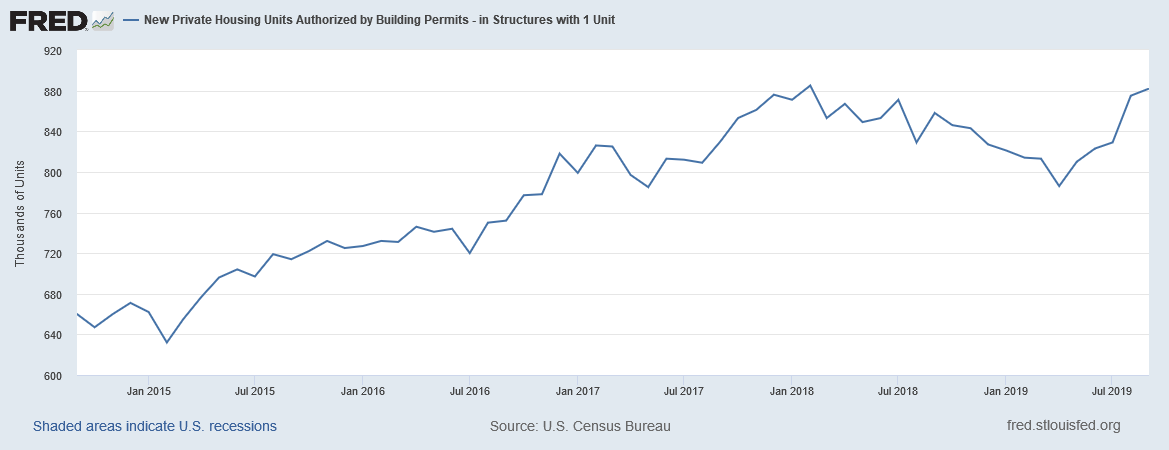
Building permits were a key reason for my increased possibility of a recession earlier this year. But this statistic has reversed its downward trajectory and is now just shy of its high for the expansion.
Finally, the yield curve's overall picture has improved:
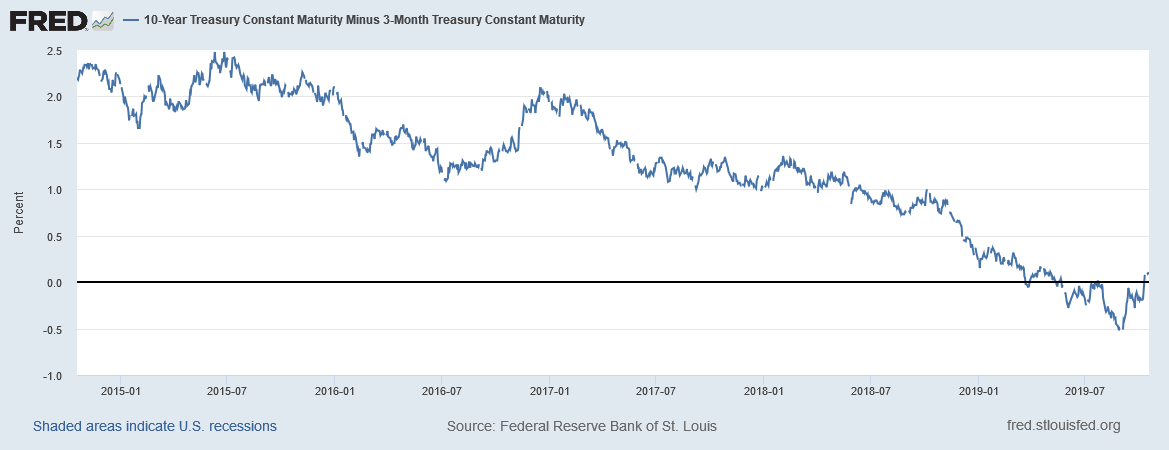
The 10-year-3-month spread is now barely positive after spending most of the summer inverted.
And the belly of the curve is also showing fewer signs of economic stress:
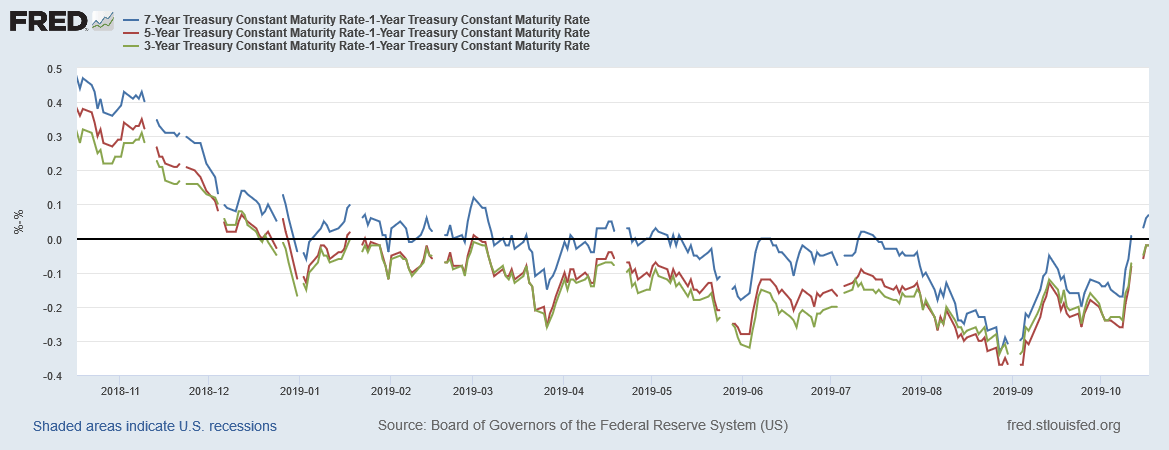
A few of the 7/5/3-year-1-year spreads - which have been inverted in varying degrees - are now positive.
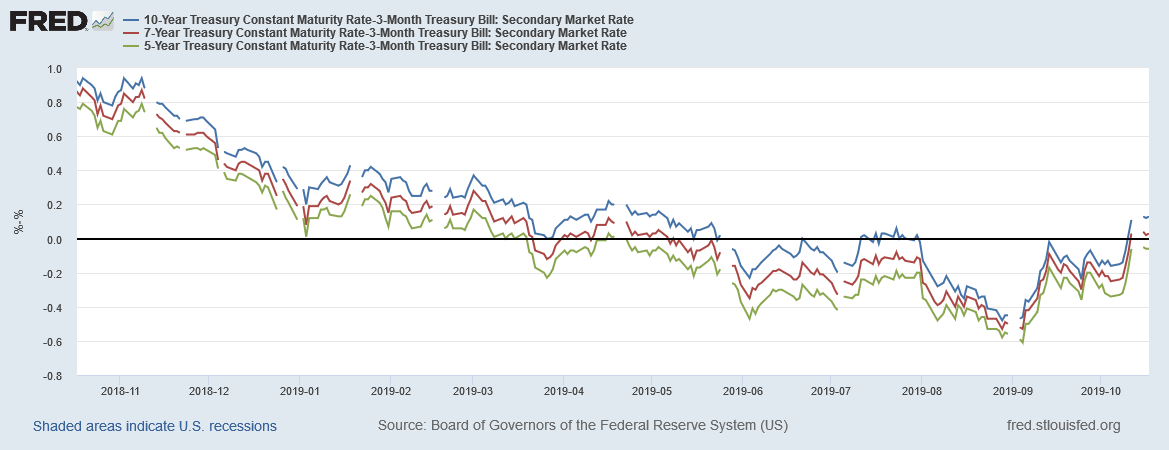
And the 10/7/5-year spreads - which have also been trending lower for the last year - are now widening a bit.
Coincidental Indicators Conclusion: these have all clearly improved. Building permits are near expansion highs while the yield curve has widened.
Coincidental Data
This week, the Census released the latest retail sales data, which reported a .3% M/M decline. But the overall trend of this data is positive:
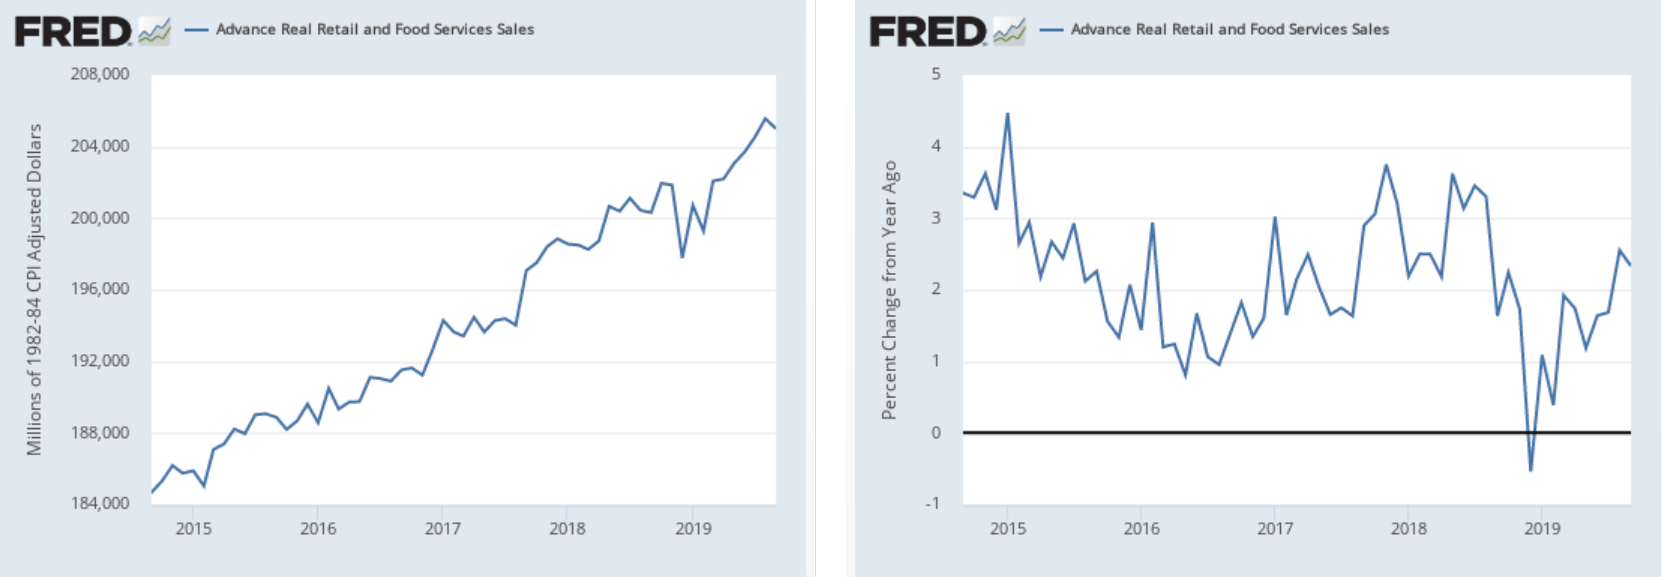
The right chart shows the total value, which trended sideways for about nine months at the end of last year and the first part of this year. But it has since started increasing again. The right chart shows the Y/Y percentage gain, which is once again growing.
The underlying trend in retail sales is positive:
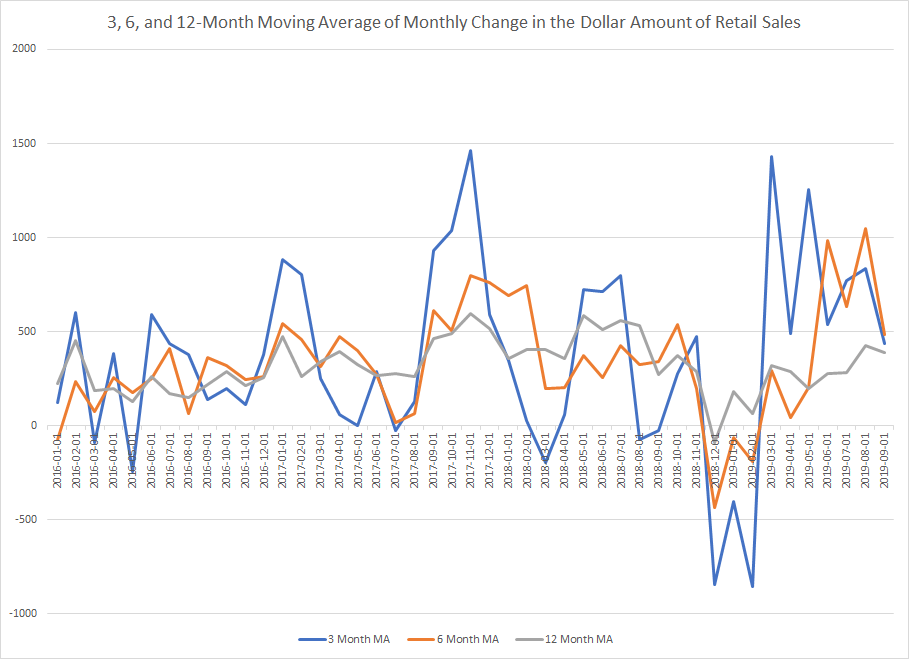
Data from the St. Louis Federal Reserve's FRED system; author's calculations
The above chart removes the monthly noise from the retail sales data by converting the monthly numbers into 3-, 6-, and 12-month moving averages. All are now converging just below the $500 million/month change, indicating that this part of the economy is doing pretty well.
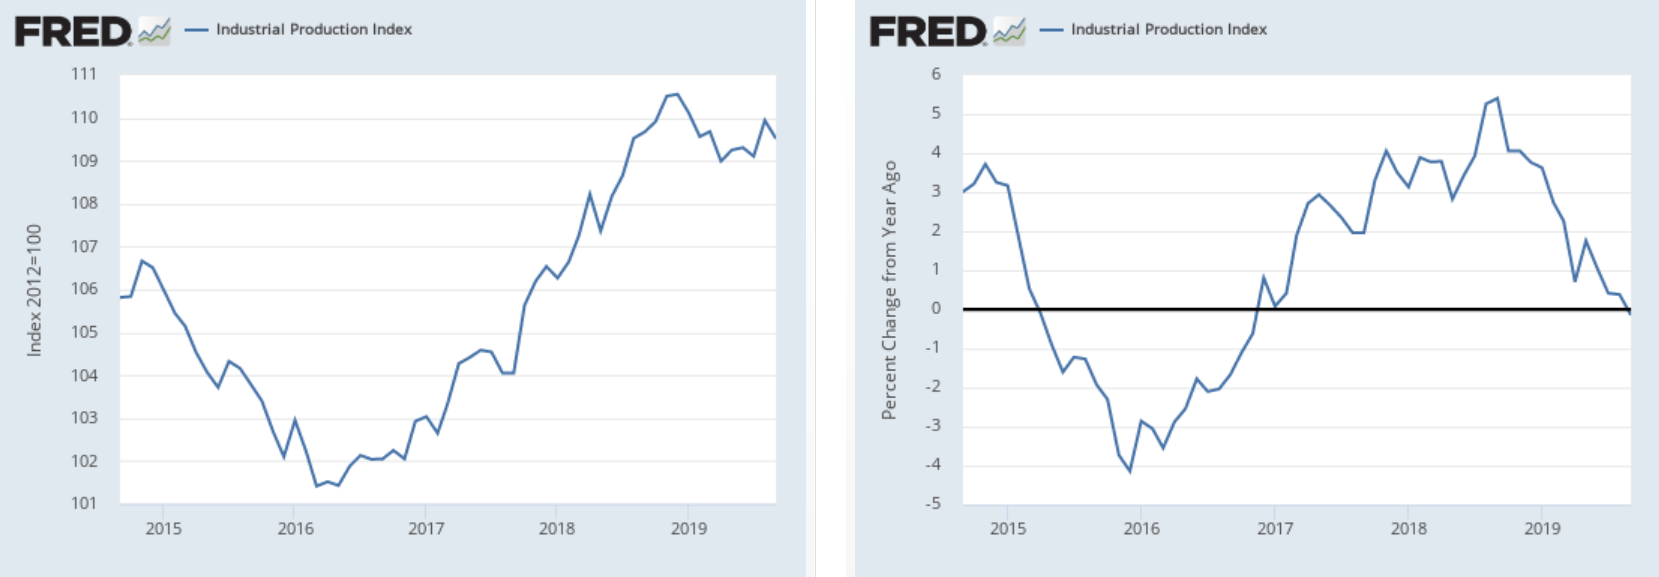
This week, the Federal Reserve issued the latest industrial production data which contained a .4% decline. The overall trend for this series is weak:
The left chart shows the total level, which dropped at the end of last year but has since stabilized. The right chart shows that the Y/Y percentage change has been trending lower and is now modestly negative.
A look at the last six months of data explains the reason for the weakness:
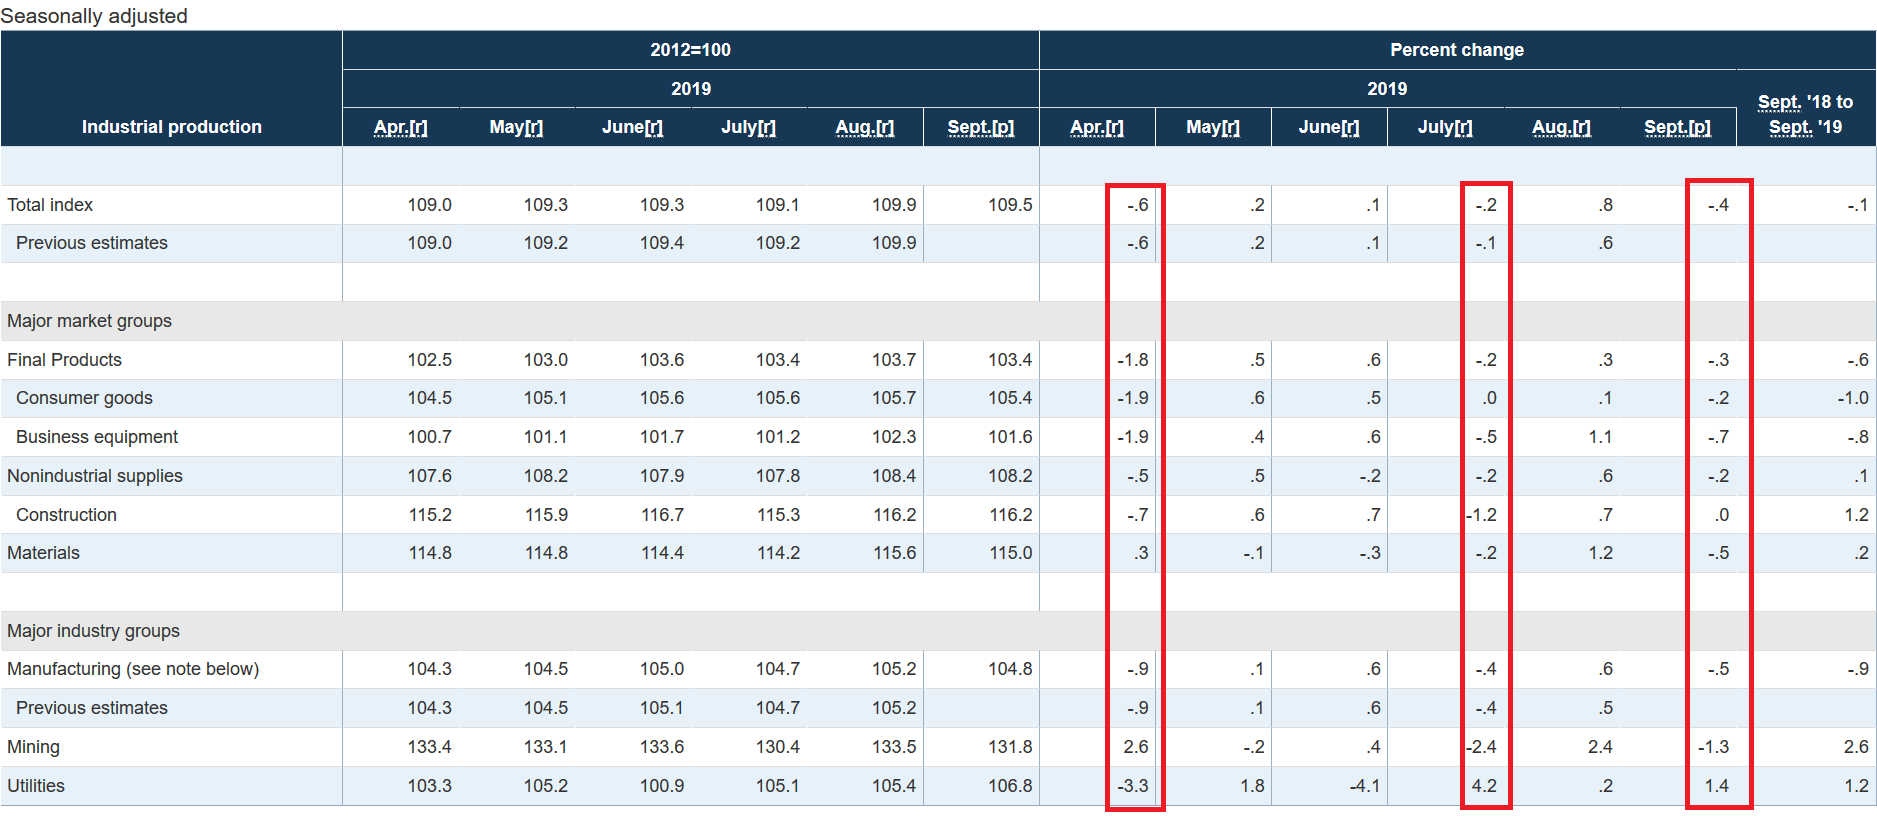
The data is experiencing a "one-step forward, two steps back" trend, with a month of expansion followed by a contraction. For example, in April, July, and September (in red), the top-line number and a majority of the sub-indexes declined. But in other months, a majority of the headline and underlying numbers increased.
The coincidental data is mostly positive. The labor market is strong and retail sales resumed growth after a lull in 4Q19-1Q10. But industrial production is fluctuating between positive and negative months due to heightened trade friction.
