Summary
The purpose of the Turning Points Newsletter is to look at the long-leading, leading, and coincidental economic indicators to determine if the US's economic trajectory has changed from expansion to contraction - to determine if the economy has reached a "Turning Point."
My recession probability in the next 6-12 months is 20%. The yield curve inversion is the main reason, as various measures of the belly of the curve have been inverted for 9-10 months. Other metrics - such as the weekly hours worked by production employees and the pace of job creation - are soft, but could just as easily indicate a downshift in the pace of growth rather than a recession.
Long-Leading Indicators
In general, these are positive: BEA measured corporate profits are rising, M2 money stock is growing (in fact, its Y/Y increase has risen from a little over 3% at the end of 2018 to ~5.75%), and BBB effective yields are low. However, there's been an uptick in CCC yields:
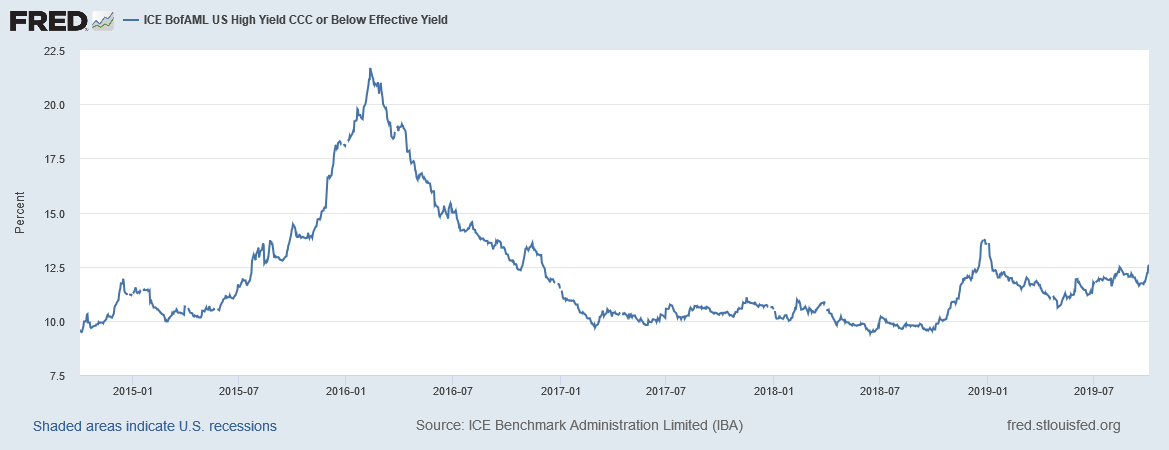
The above chart shows that the uptick is modest by historical comparison. But the pace is fairly sharp:
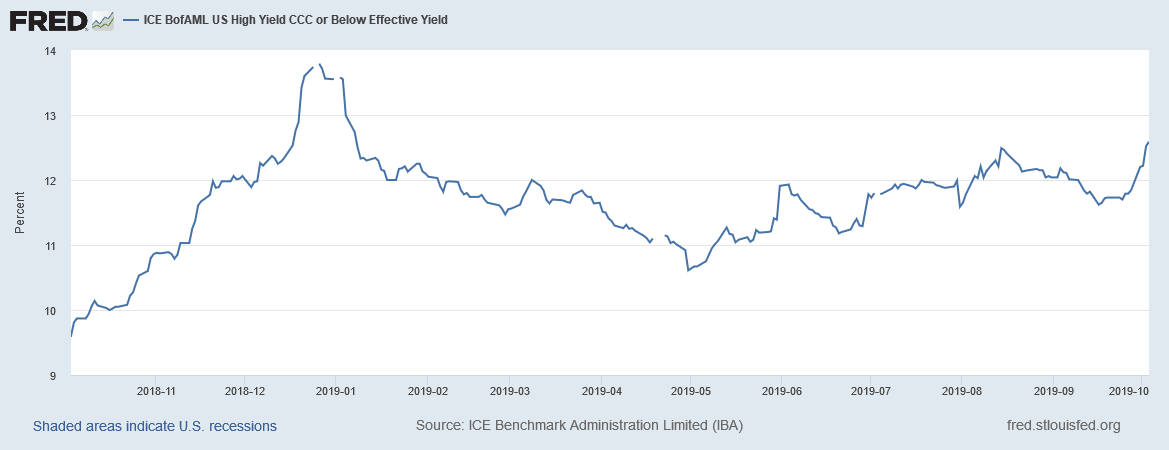
There's been a fair amount of press centered on WeWork bonds not only converting to junk status but also being affected by a wave of short sellers. This could have started a wave of short-selling in the junk sector, leading to the recent spike in yields. This section of the credit markets also trades far more like stocks instead of bonds, meaning quick moves are more common. However, this is not the only section of the credit markets to recently experience problems: the repo market was subject to a liquidity crunch a few weeks ago. The CCC yield increase is something to keep an eye on going forward.
Long-leading data conclusion: the data is positive. With the exception of CCC yields, the indicators point towards continued expansion.
Leading Indicators
According to the latest employment report, weekly hours of production workers are still at their lowest level in five years:
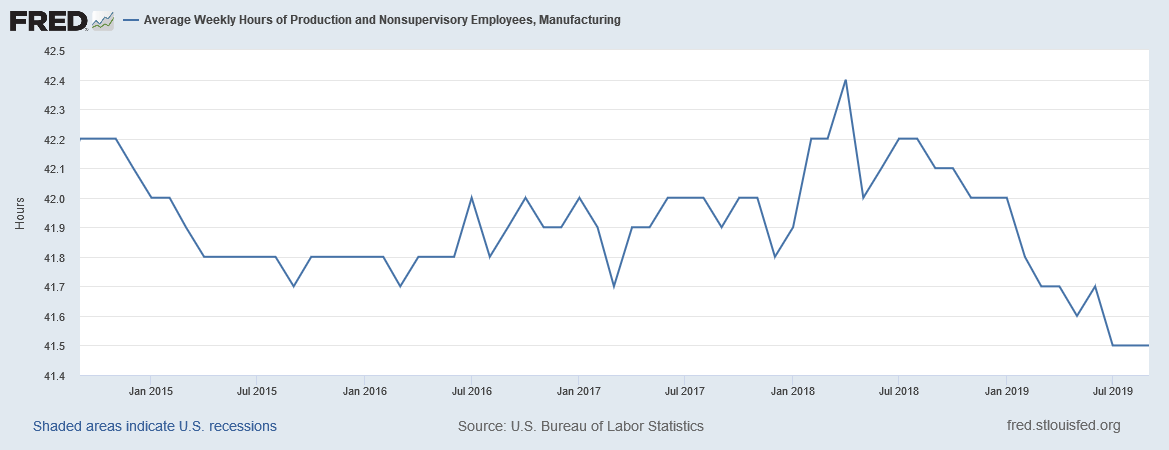
Hours are the first employment statistic to drop because it allows employers to keep their current employees while simply using the resource to a lesser degree.
The government yield curve which comprises the backbone of my 20% recession probability has undergone a fundamental transformation in the last 10 months. The entire curve has dropped as shown in the following table:

The following graphs put the data into context:
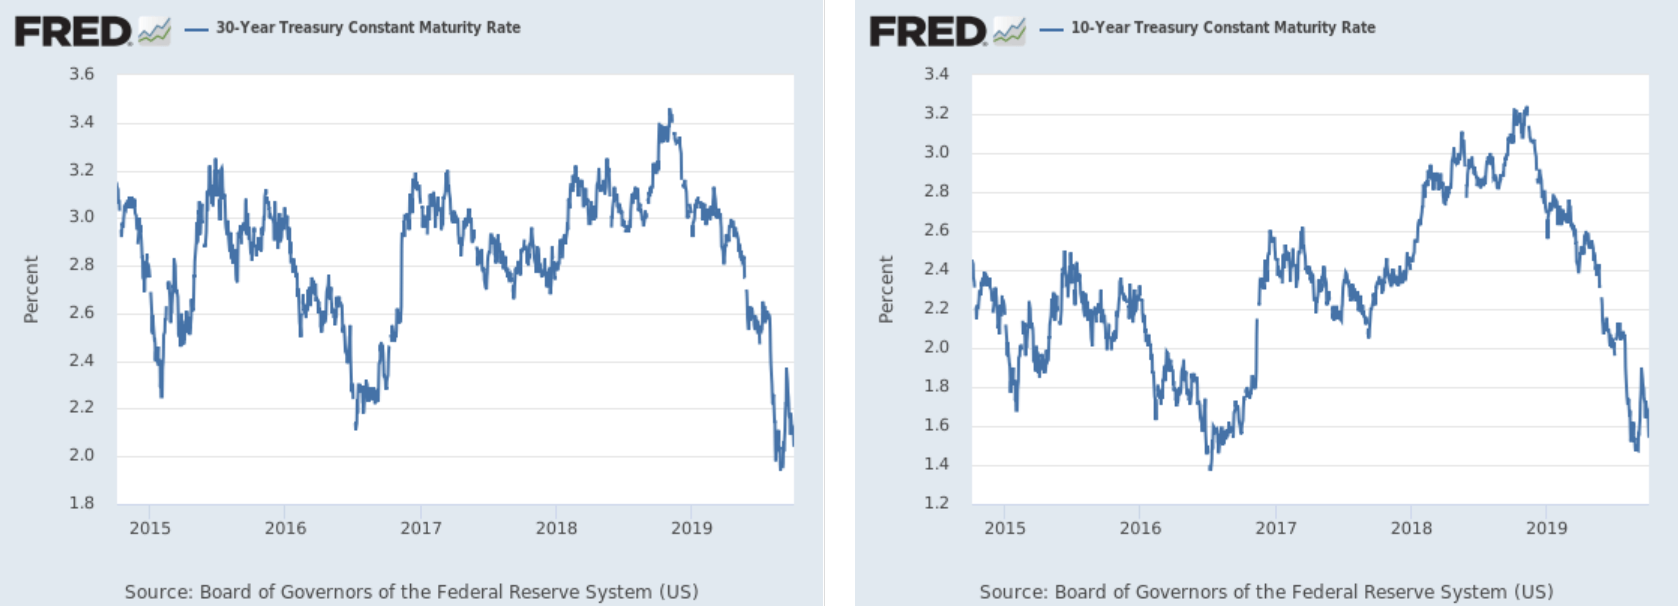
These are five-year charts. In the last 9-10 months, the yields on both the 30- and 10-year charts have traversed the entire chart.
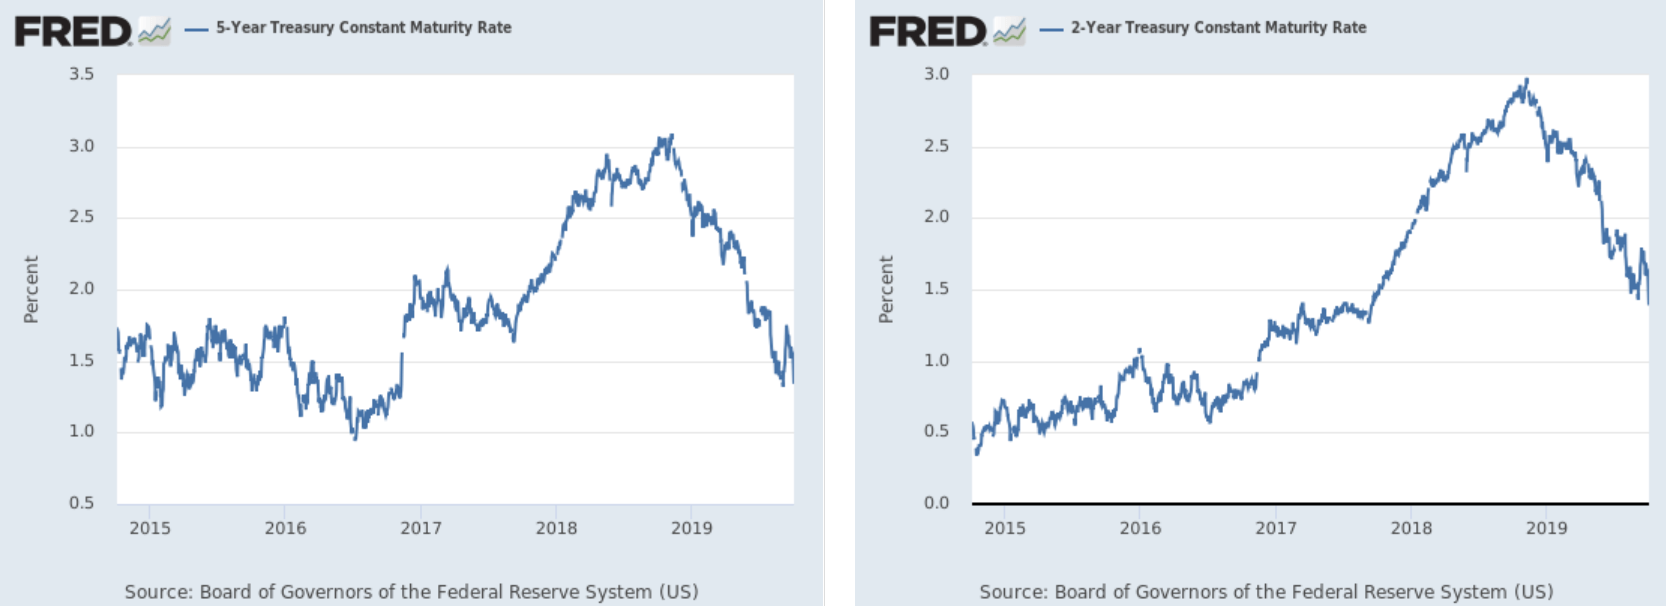
The 5-year Treasury chart (left) and the 2-year treasury chart (right) have dropped as sharply as the 30- and 10-year Treasuries in basis points. But they haven't traversed the entire chart.
The government bond market is still a very conservative, stodgy market. It's also far more influenced by economic data. Large moves are very atypical unless there's a fundamental change in the economic backdrop, which is why the yield curve's shape remains a key leading indicator. And various yield curve measures have been inverted for some time:
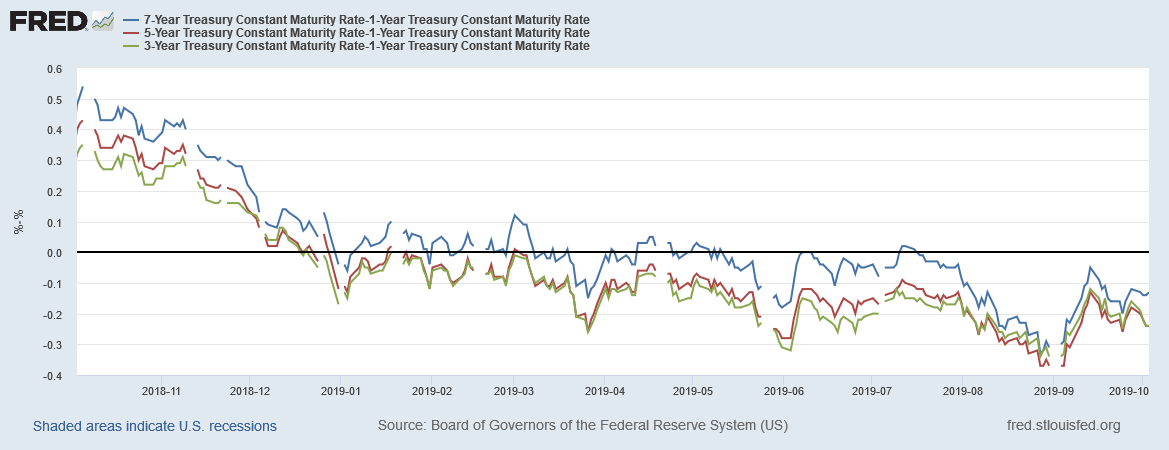
The 7/5/3-year-1-year section of the curve first inverted at the end of last year and has remained mostly inverted to varying degrees since.
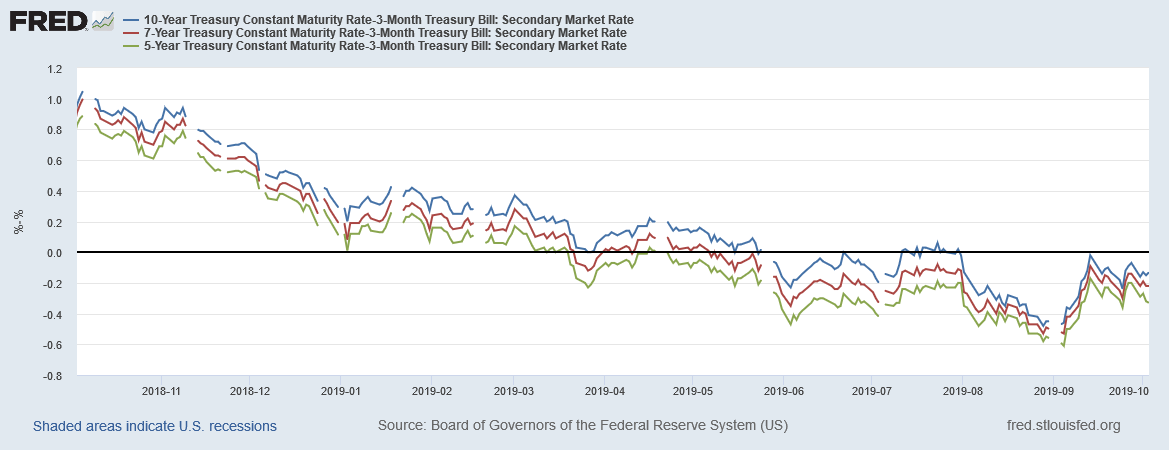
The 7/5/3-year-1-year section of the curve first inverted at the end of last year and has remained mostly inverted to varying degrees since.
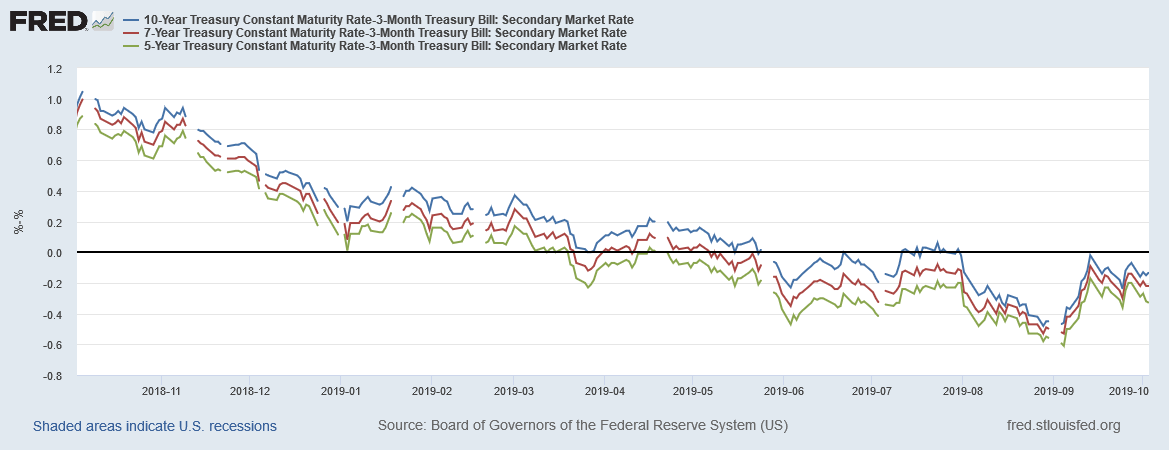
The 10/7/5-year-3-month spread first inverted at the end of March. All three have trended mostly lower since.
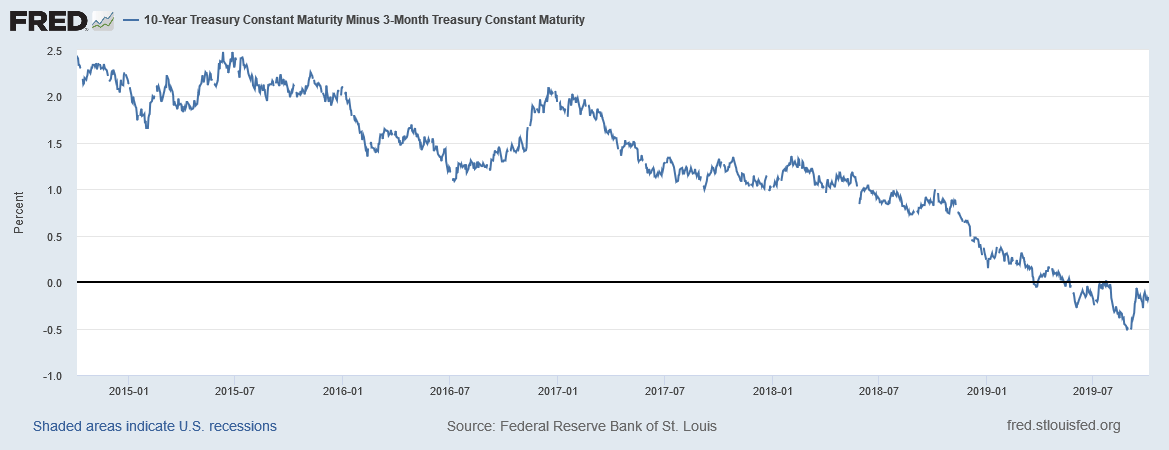
Finally, there's the 10-year-3-month spread which has been mostly inverted since the beginning of June.
The ISM Manufacturing report is not a formal leading indicator in the Burns-Moore school of economic analysis. But new orders for business capital equipment and consumer durable goods are, which makes the ISM data tangentially relevant. The ISM headline number has been below an expansionary reading of 50 for two months, as have the reports data for employment, new orders, and production. Just as important are the anecdotal comments in the report, which show the trade war is clearly starting to hurt.
Leading indicator conclusion: the yield curve is still the primary negative leading-indicator reading. Other leading numbers have faded in and out in importance over the last 12 months, with manufacturing sentiment being the latest example. Overall, the yield curve, weekly hours worked, and manufacturing sentiment are sufficient to support a 20% recession probability in the next 6-12 months.
Coincidental Data
On Friday, the BLS released the latest employment report. To remove monthly noise, here are the 3-, 6-, and 12-month moving averages of the monthly payroll gains:
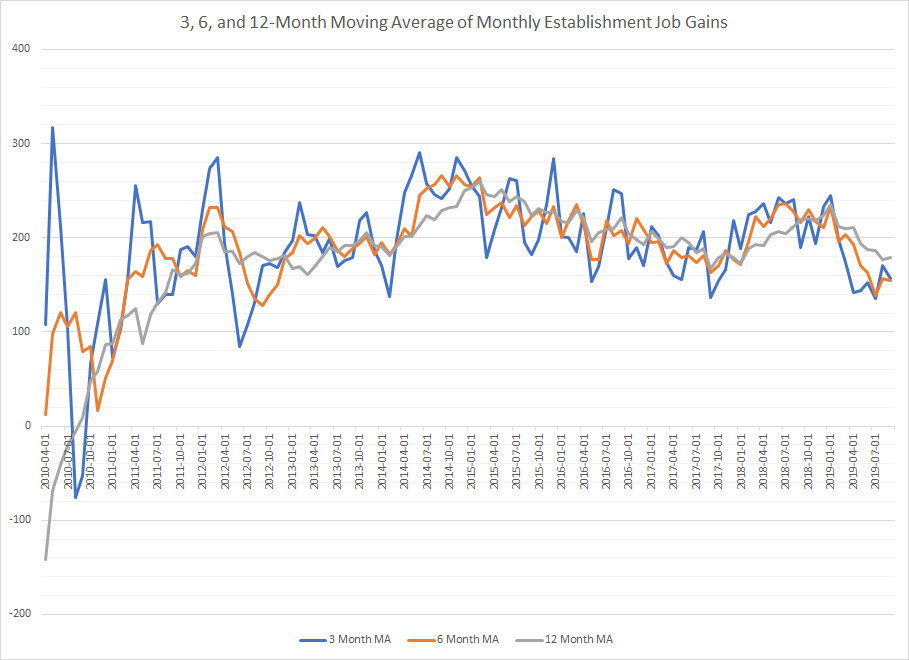
Data from the St. Louis Federal Reserve; author's calculations
The 3- and 6-month moving average of establishment job gains appear to be centering on the 150,000/month average. For an expansion that has entered its 10th year, this is a very understandable development. It's not fatal, but it does indicate that the pace of hiring has slowed a bit.
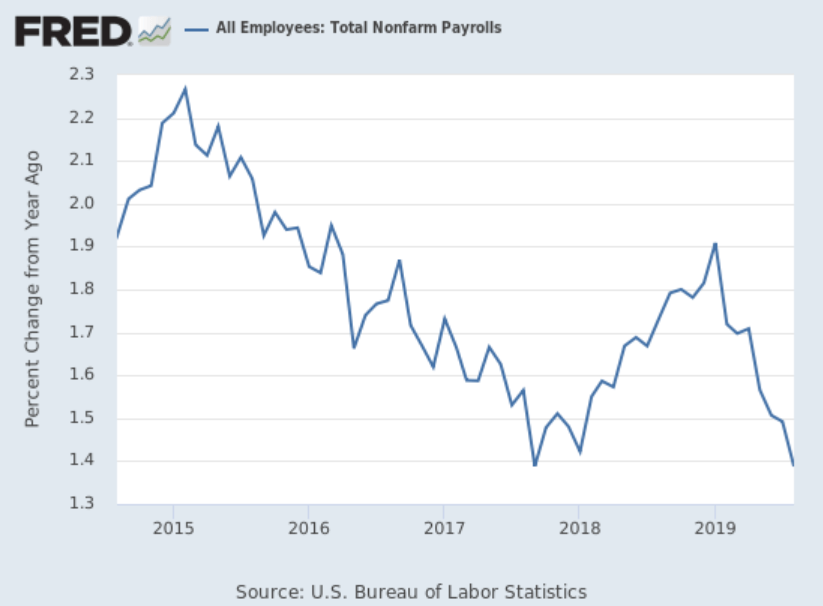
In addition, the pace of Y/Y establishment job growth continues to decline:
Other coincidental data is positive: industrial production is once again rising; retail sales continue to expand as does personal income less transfer payments. Average hourly earnings are still rising long-term.
Coincidental indicators conclusion: Various pieces of coincidental data have alternated soft readings over the last 12-18 months - retail sales were soft at the beginning of the year; industrial production was off modestly at the end of last year - but then subsequently returned to trend. The complete data picture is one of an economy at the end of an expansion.
