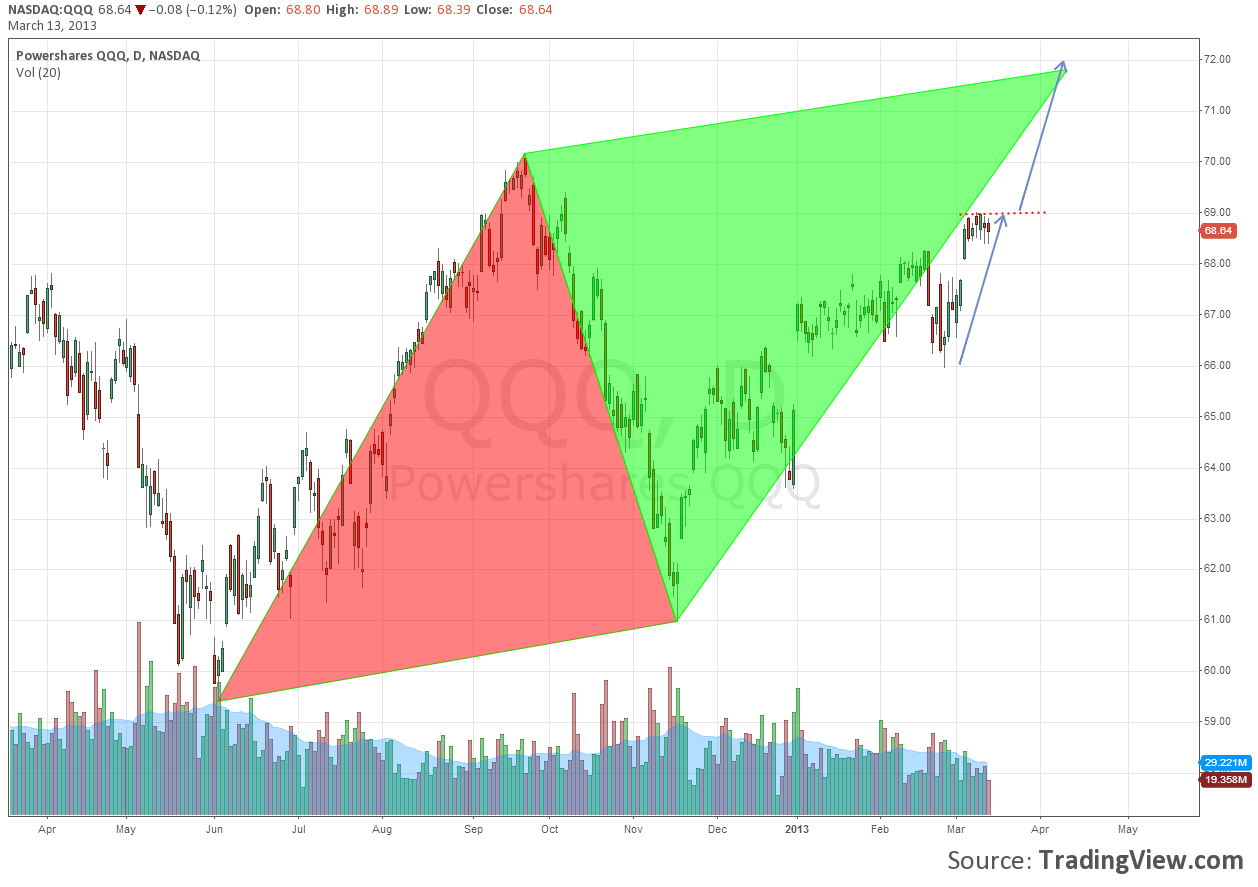
Technical Analysis (TA) can be tedious work, pouring over data or charts or both. And if you practice with more than one type of TA double or triple your workload. Ugh. Until you see multiple methods leading to the same conclusion and you start to smell money. That is the current case in the Powershares QQQ, $QQQ, recently. The chart below shows that from June last year it is in the final stretches of completing an AB=CD pattern with a target at 71.85. This should have kept you
long the QQQ’s and buying dips at year end and in late February. But the action of the last 2 weeks has done a lot to not only reaffirm the bullish view but reinforce the target area. The arrows show that the rise to the current consolidation at 69 give a target on the Measured Move to 72.06, just above the AB=CD target. Isn’t great when two different methodologies come to the same conclusion. I am currently long April/May 71 Call Calendars to take advantage of this. How would you play this chart?
The information in this blog post represents my own opinions and does not contain a recommendation for any particular security or investment. I or my affiliates may hold positions or other interests in securities mentioned in the Blog, please see my Disclaimer page for my full disclaimer.
Original post
- English (UK)
- English (India)
- English (Canada)
- English (Australia)
- English (South Africa)
- English (Philippines)
- English (Nigeria)
- Deutsch
- Español (España)
- Español (México)
- Français
- Italiano
- Nederlands
- Português (Portugal)
- Polski
- Português (Brasil)
- Русский
- Türkçe
- العربية
- Ελληνικά
- Svenska
- Suomi
- עברית
- 日本語
- 한국어
- 简体中文
- 繁體中文
- Bahasa Indonesia
- Bahasa Melayu
- ไทย
- Tiếng Việt
- हिंदी
2 Reasons I Am Long The QQQ’s
Published 03/14/2013, 08:16 AM
Updated 05/14/2017, 06:45 AM
2 Reasons I Am Long The QQQ’s
Latest comments
Loading next article…
Install Our App
Risk Disclosure: Trading in financial instruments and/or cryptocurrencies involves high risks including the risk of losing some, or all, of your investment amount, and may not be suitable for all investors. Prices of cryptocurrencies are extremely volatile and may be affected by external factors such as financial, regulatory or political events. Trading on margin increases the financial risks.
Before deciding to trade in financial instrument or cryptocurrencies you should be fully informed of the risks and costs associated with trading the financial markets, carefully consider your investment objectives, level of experience, and risk appetite, and seek professional advice where needed.
Fusion Media would like to remind you that the data contained in this website is not necessarily real-time nor accurate. The data and prices on the website are not necessarily provided by any market or exchange, but may be provided by market makers, and so prices may not be accurate and may differ from the actual price at any given market, meaning prices are indicative and not appropriate for trading purposes. Fusion Media and any provider of the data contained in this website will not accept liability for any loss or damage as a result of your trading, or your reliance on the information contained within this website.
It is prohibited to use, store, reproduce, display, modify, transmit or distribute the data contained in this website without the explicit prior written permission of Fusion Media and/or the data provider. All intellectual property rights are reserved by the providers and/or the exchange providing the data contained in this website.
Fusion Media may be compensated by the advertisers that appear on the website, based on your interaction with the advertisements or advertisers.
© 2007-2025 - Fusion Media Limited. All Rights Reserved.
