Amazon.com, Inc. (NASDAQ:AMZN) is slated to report third-quarter earnings after tonight's close. Currently, Trade-Alert pegs the implied earnings deviation at 9.1%, more than doubling the 4% move the FAANG stock has averaged over the last two years. Five of those eight earnings reactions have been positive, including the past four in a row, while just one of Amazon's post-earnings performances was large enough to exceed the options market's expectations for tomorrow's trading -- a 13.2% pop in October 2017.
Speculative players have been call-skewed ahead of earnings, though this is just business as usual in Amazon's options pits. At the International Securities Exchange (ISE), Chicago Board Options Exchange (CBOE), and NASDAQ OMX PHLX (PHLX), the stock's 10-day call/put volume ratio of 1.16 ranks in the 55th annual percentile. The November 1,800 call has seen one of the biggest increases in open interest over this time frame, while traders are targeting the weekly 10/26 1,800-strike call today.
Meanwhile, the stock's 30-day at-the-money implied volatility (IV) of 45.4% ranks in the 97th annual percentile, meaning short-term options are pricing in elevated volatility expectations at the moment -- not unusual ahead of a scheduled event like earnings. Plus, the stock's 30-day IV skew of 11.6% ranks in the 83rd percentile of its annual range, meaning near-term calls are currently cheaper than puts, historically speaking.
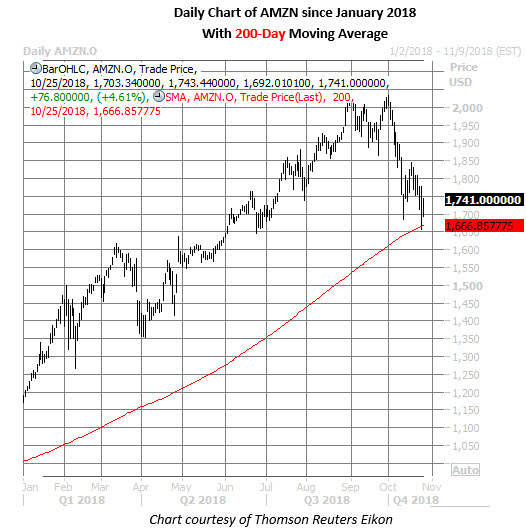
On the charts, Amazon has struggled alongside the broader tech sector in October, down 13.2% month-to-date. However, this selling stalled out yesterday right at AMZN's 200-day moving average. In today's trading, the shares are up 4.6% at $1,741.

Alphabet Inc (NASDAQ:NASDAQ:GOOGL) will also reveal its third-quarter results after tonight's close, with the options market pricing in a 7% swing for tomorrow's trading, regardless of direction. Over the past eight quarters, GOOGL stock has averaged a single-session post-earnings move of 3.3%, with half of those returns positive. However, not one of these eight most recent earnings reactions has met or exceeded the current implied earnings deviation.
Options traders at the major exchanges have been positioning for a downside move from GOOGL. At the ISE, CBOE, and PHLX, the security's 10-day put/call volume ratio of 0.89 ranks in the 88th percentile of its annual range, meaning puts have been bought to open relative to calls at an accelerated pace in recent weeks.
Those purchasing short-term options are likely encountering relatively rich premiums at the moment, per GOOGL's Schaeffer's Volatility Index (SVI) of 44% -- in the 100th annual percentile. However, the FAANG stock has been an attractive target for premium buyers over the last year, as evidenced by its Schaeffer's Volatility Scorecard (SVS) reading of 83 (out of a possible 100). In other words, the equity has tended to make outsized moves compared to what the options market has anticipated.
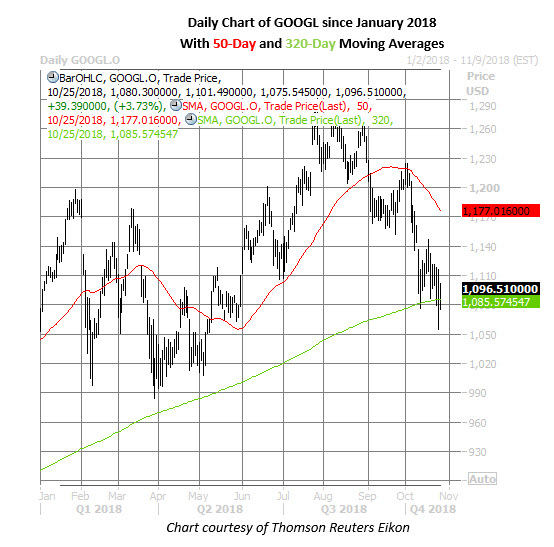
The tech sector sell-off has hit Alphabet shares hard in recent weeks, too. After being rejected by their 50-day moving average at the start of October, GOOGL shares have surrendered 10.1%. However, the equity's 320-day moving average has recently emerged as potential support, with the shares up 3.7% at $1,096.51 today, following a successful test of this trendline.

