Trade tensions between Washington and Beijing have kept U.S.-listed Chinese stocks on the collective radar. Two names in particular that options traders have been eyeing are Hangzhou-based e-commerce concern Alibaba (NYSE:BABA) and Shanghai-based electric car maker Nio (NYSE:NIO)
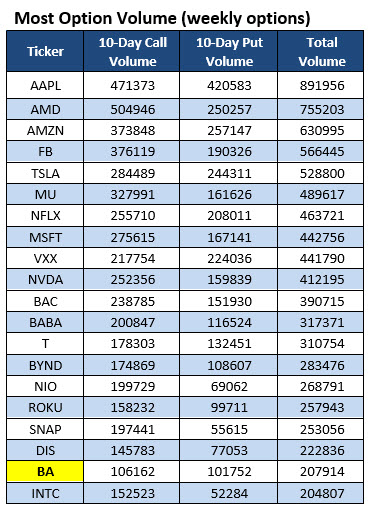
In fact, both BABA and NIO popped up on a list of stocks that have seen the heaviest weekly options activity in the past 10 days, courtesy of Schaeffer's Senior Quantitative Analyst Rocky White, with names highlighted in yellow new to the list. The bulk of activity for both BABA and NIO has occurred on the call side.

Alibaba Bulls See More Upside
Alibaba saw 200,847 calls change hands over the past two weeks, compared to 116,524 puts. A healthy portion of this was likely a result of speculators purchasing new positions, per BABA's 10-day call/put volume ratio of 2.36 at the International Securities Exchange (ISE), Cboe Options Exchange (CBOE), and NASDAQ OMX PHLX (PHLX), which ranks in the 74th annual percentile, meaning calls have been bought to open over puts at an accelerated clip.
Drilling down, the September 175 call saw the biggest increase in open interest over this two-week time frame, and was likely used alongside the September 175 put to initiate a straddle in the now back-month series. As far as weekly options, nearly 6,000 weekly 8/30 180-strike calls were initiated in the last 10 sessions, some of which were bought, according to data from the major options exchanges.
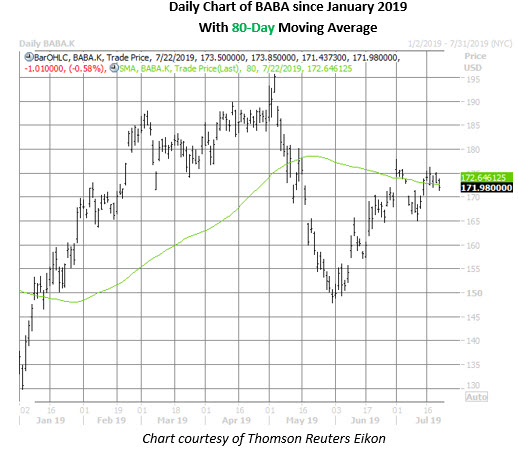
Today, amid lighter-than-usual volume, speculators appear to be buying to open BABA's weekly 7/26 175-strike call for a volume-weighted average price of $1.11. By doing so, call buyers expect the stock to jump above breakeven at $176.11 (strike plus premium paid) by expiration at the close this Friday, July 26. At last check, Alibaba stock is down 0.6% at $171.98, testing recent support at its 80-day moving average and a trendline connecting higher lows since late May.

Nio Call Traders See Bigger Short-Term Gains
In the last 10 sessions, 199,729 Nio call options traded, compared to 69,062 puts. Data from the ISE, CBOE, and PHLX confirms significant buy-to-open activity in the past two weeks, per the stock's top-heavy 10-day call/put volume ratio of 4.05.
While the August 3 call saw the biggest increase among non-expired options over this time frame, the weekly 7/26 3.50-strike call was also popular. Data from the major options exchanges confirms significant buy-to-open activity at each strike, meaning speculators are targeting short-term gains for the Chinese stock.
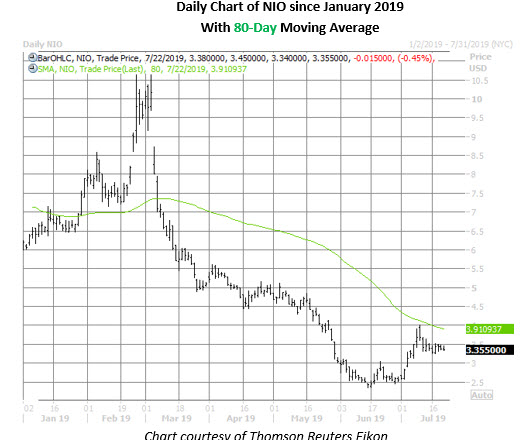
Most recently, though, NIO shares are trading down 0.5% at $3.35. The equity rebounded from its June 17 record low of $2.35, but ran out of steam at the $4 mark -- near its 80-day moving average and its late-May pre-bear gap levels. Year-to-date, Nio stock is down 47.4%.

