The summer season began last weekend with the Memorial Day holiday in the United States. It was a spring season to forget in the U.S. and around the world. The global pandemic kept us in our homes, away from friends and family, and wondering if the self-induced coma in the economy would ever end.
Markets remain nervous as the economy begins to reopen slowly. Time will tell if the worst of COVID-19 is behind us or if another setback is on the horizon. The pandemic caused the demand for energy to plunge. In March, the price of nearby natural gas futures fell to the lowest level in a quarter of a century when it reached $1.519 per MMBtu. In April, NYMEX crude oil fell into negative territory for the first time.
Both crude oil and natural gas have recovered from their recent lows as production has declined, and some demand is creeping back into the markets. On Thursday, May 28, the Energy Information Administration released its weekly inventory data for the week ending on May 22.
The United States Natural Gas Fund (NYSE:UNG) is the ETF product that moves higher and lower with the price of NYMEX natural gas futures.
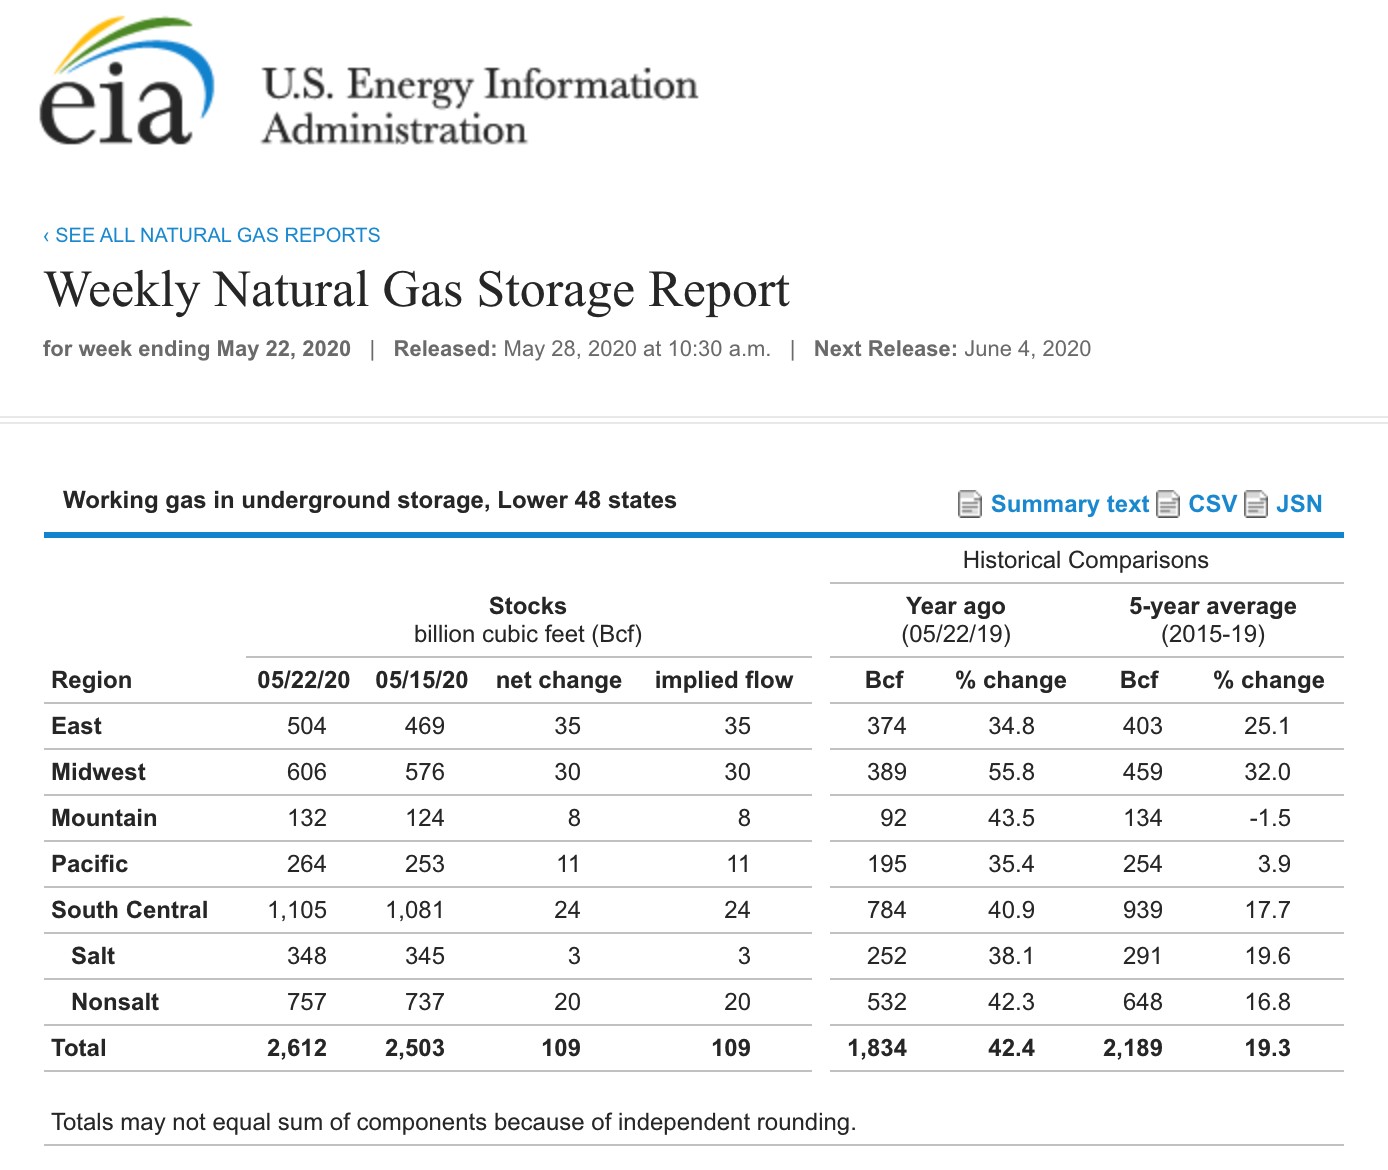
Expectations For A 105 bcf Injection

(Source: EIA)
As the chart illustrates, the increase in stockpiles came in marginally above the average consensus estimate at 109 bcf. Stocks stood at 2.612 trillion cubic feet on May 22, 42.4% above last year’s level, and 19.3% over the five-year average for this time of year.
The June futures contract in the natural gas arena rolled to July this week.

(Source: CQG)
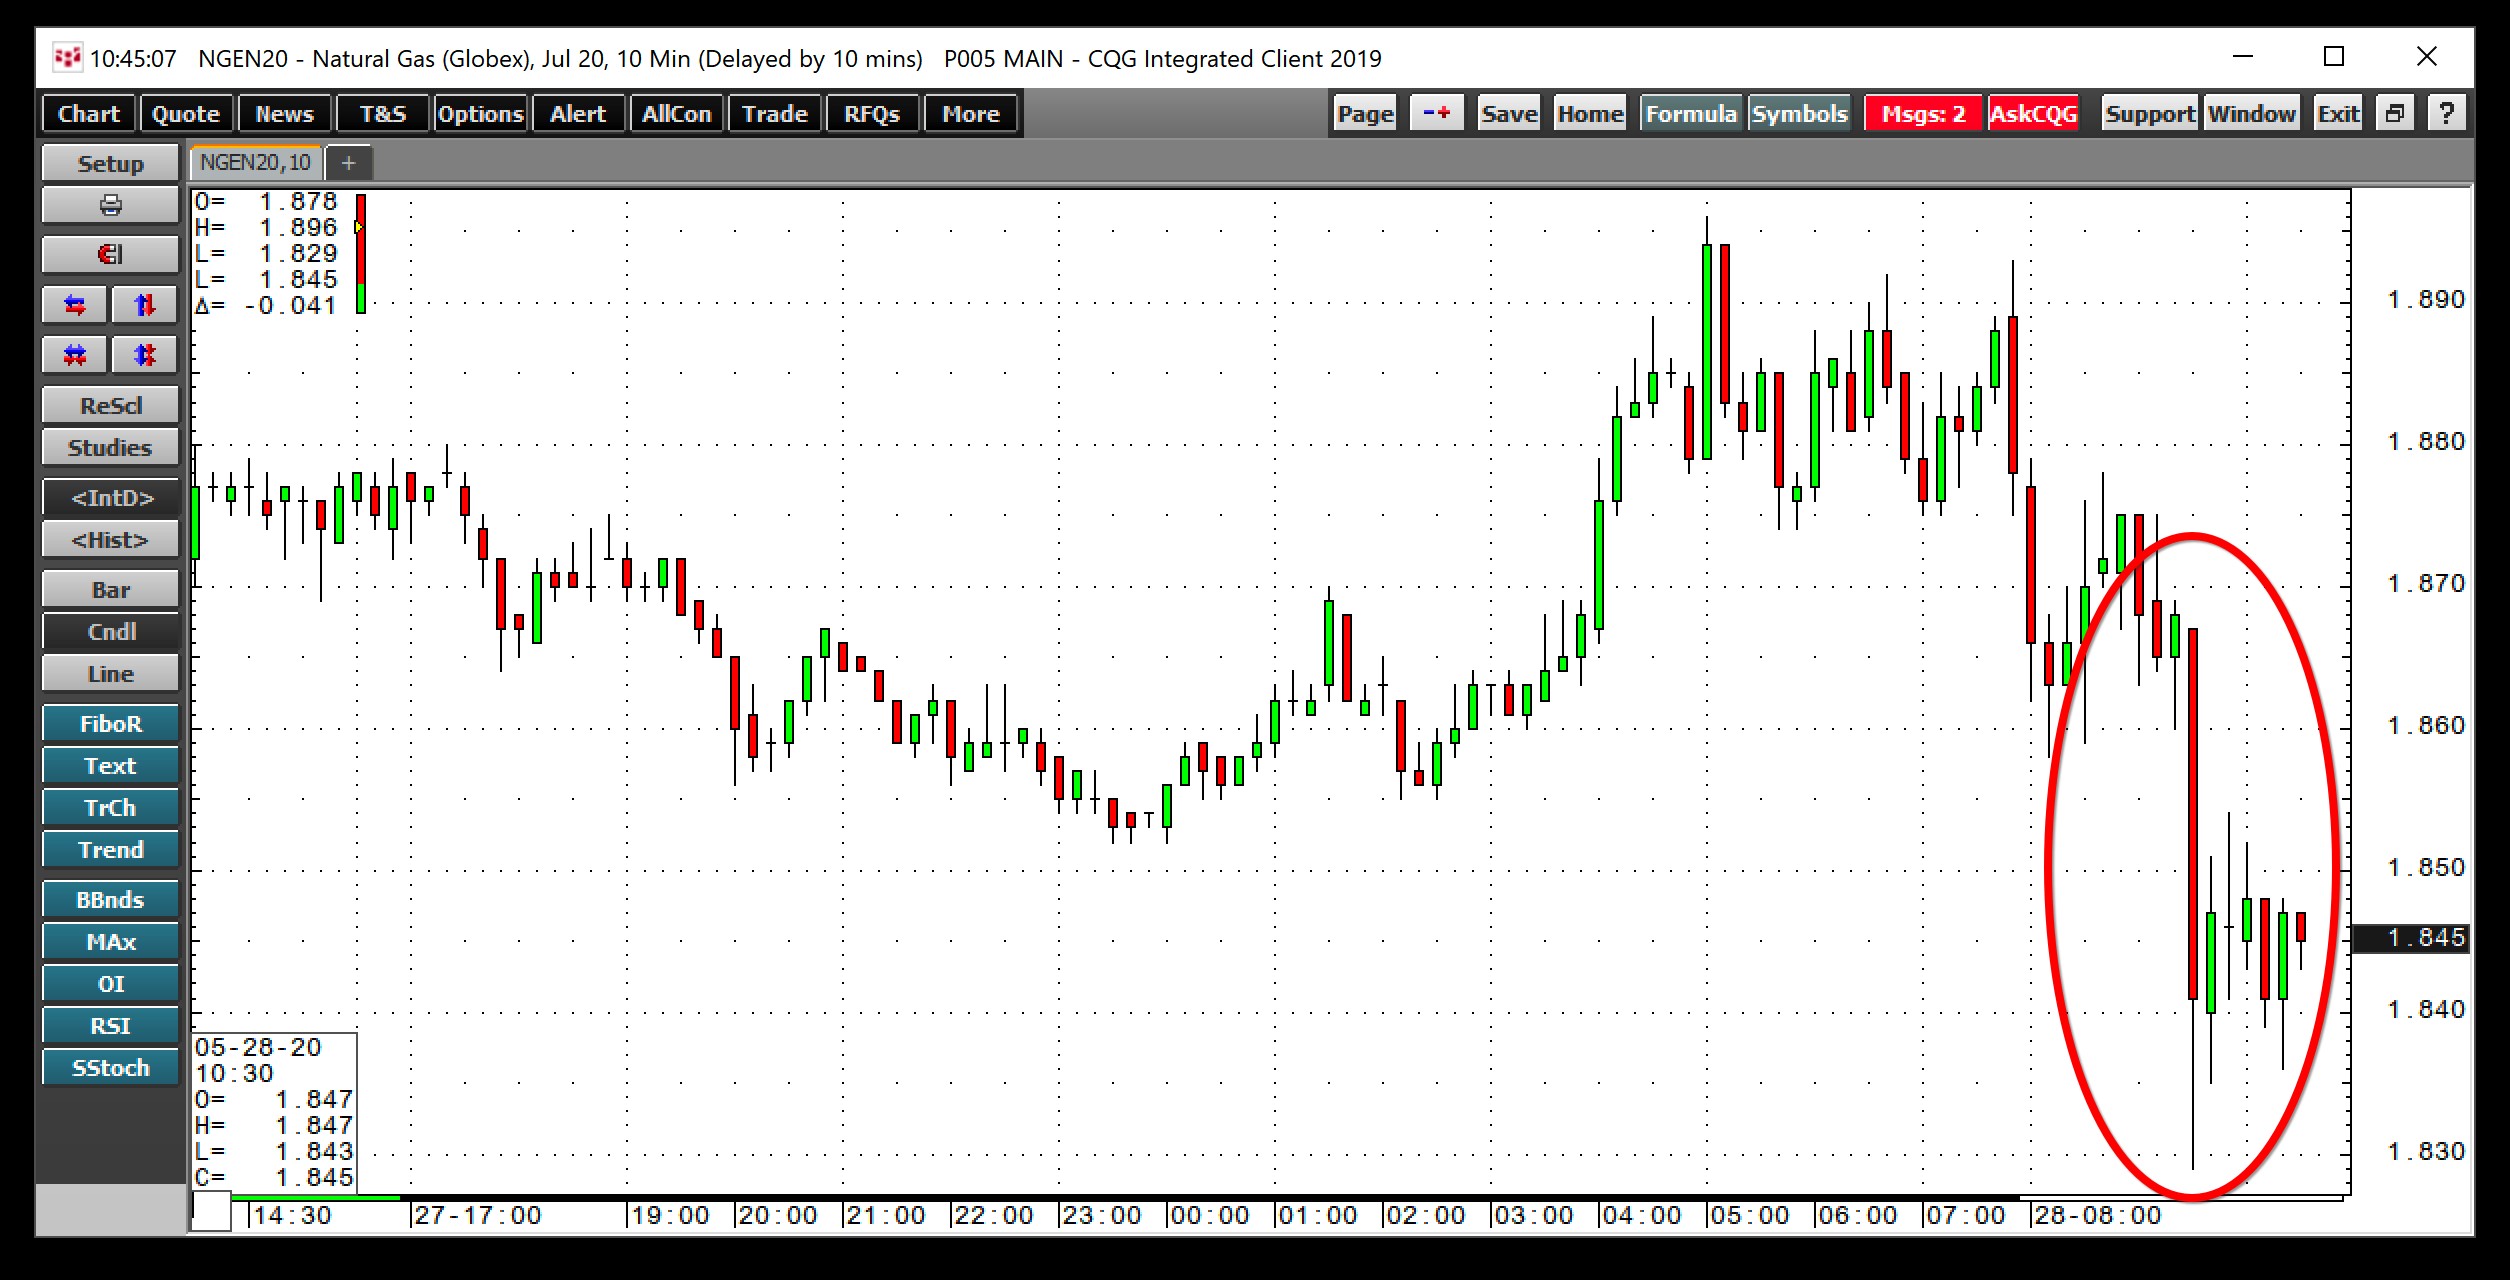
The 10-minute chart shows that the initial reaction of the slightly larger than expected injection that was over 100 bcf sent the price of July futures to a low of $1.829 per MMBtu.
Bullish Trend On Weekly Chart: Trend In Stockpiles Continues
Two bullish factors could support the price of natural gas over the coming days and perhaps weeks, after its initial marginal decline in the aftermath of the latest inventory data from the EIA.

(Source: CQG)
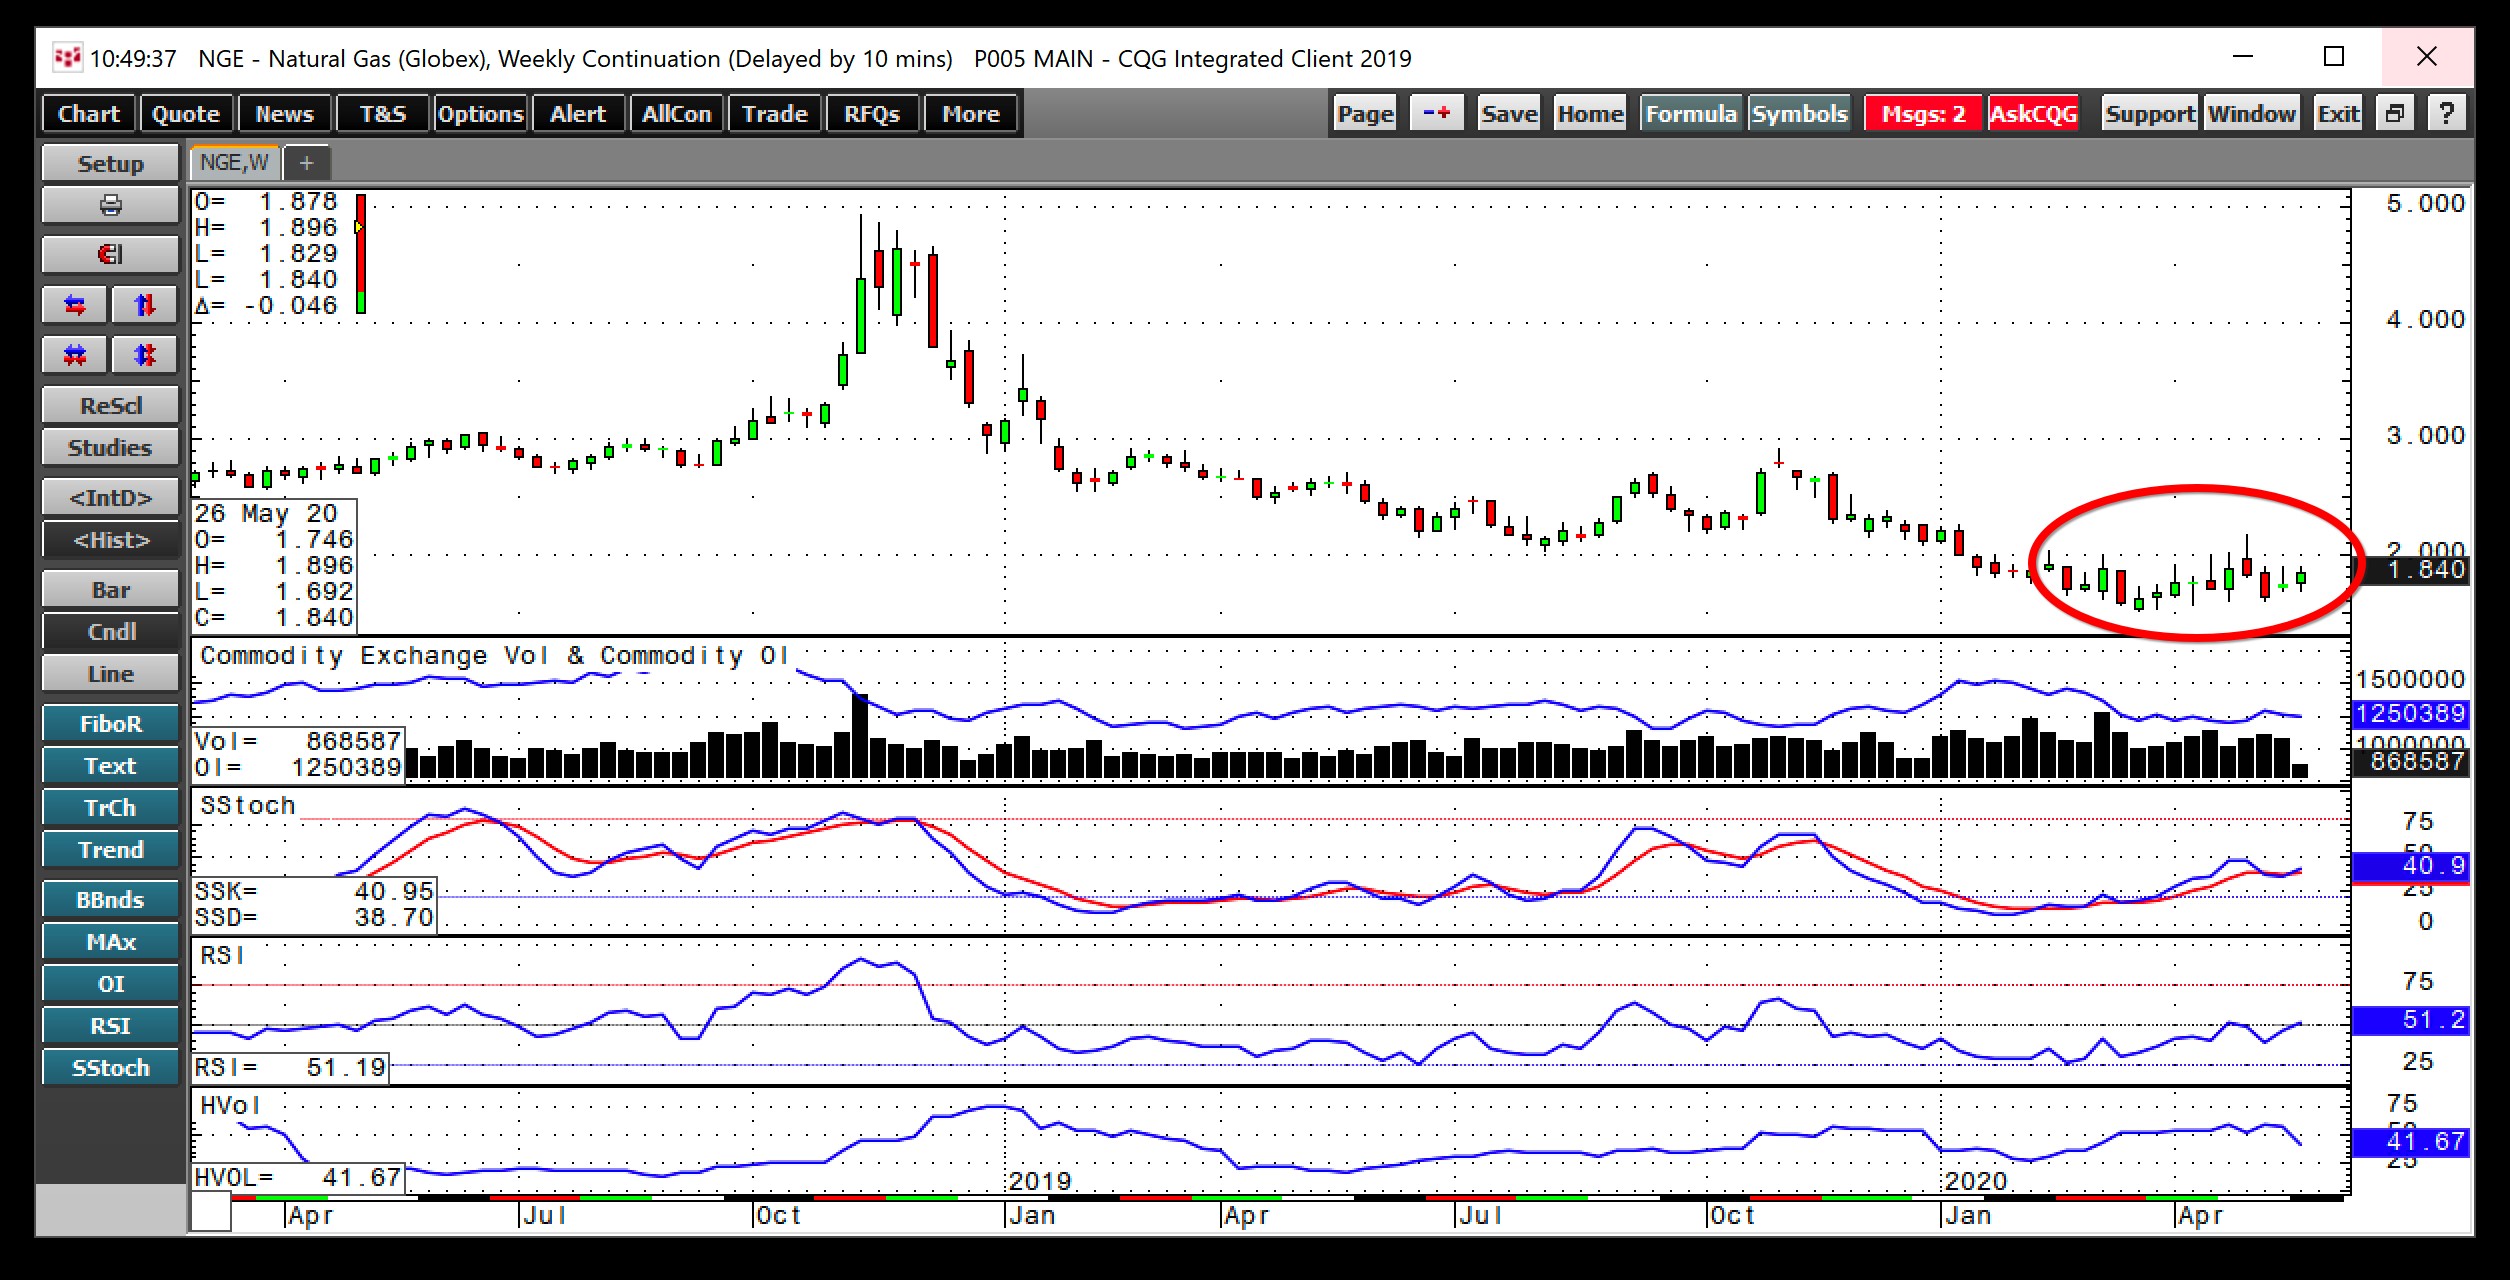
The weekly chart highlights that the price of the energy commodity has made marginally higher lows since trading to the 25-year low at $1.519 in March. Both price momentum and relative strength indicators were trending higher on either side of neutral readings, Open interest at 1.25 million contracts was just slightly lower than last year at this time. At around 41.6% weekly historical volatility remains at an elevated level indicating broad weekly trading ranges in the energy commodity. The weekly chart is modestly bullish, as is the trend in stockpiles.
The amount of gas in storage as of May 22 was 42.4% higher than last year, which was at a lower percentage than the previous week when it stood at 45.2% above last year’s level. May 22 was the ninth consecutive week where the percentage declined, which could reflect a drop in production because of low prices and weaker demand for energy on the back of the pandemic.
The $1.80 level is short-term support on the active month July futures contract
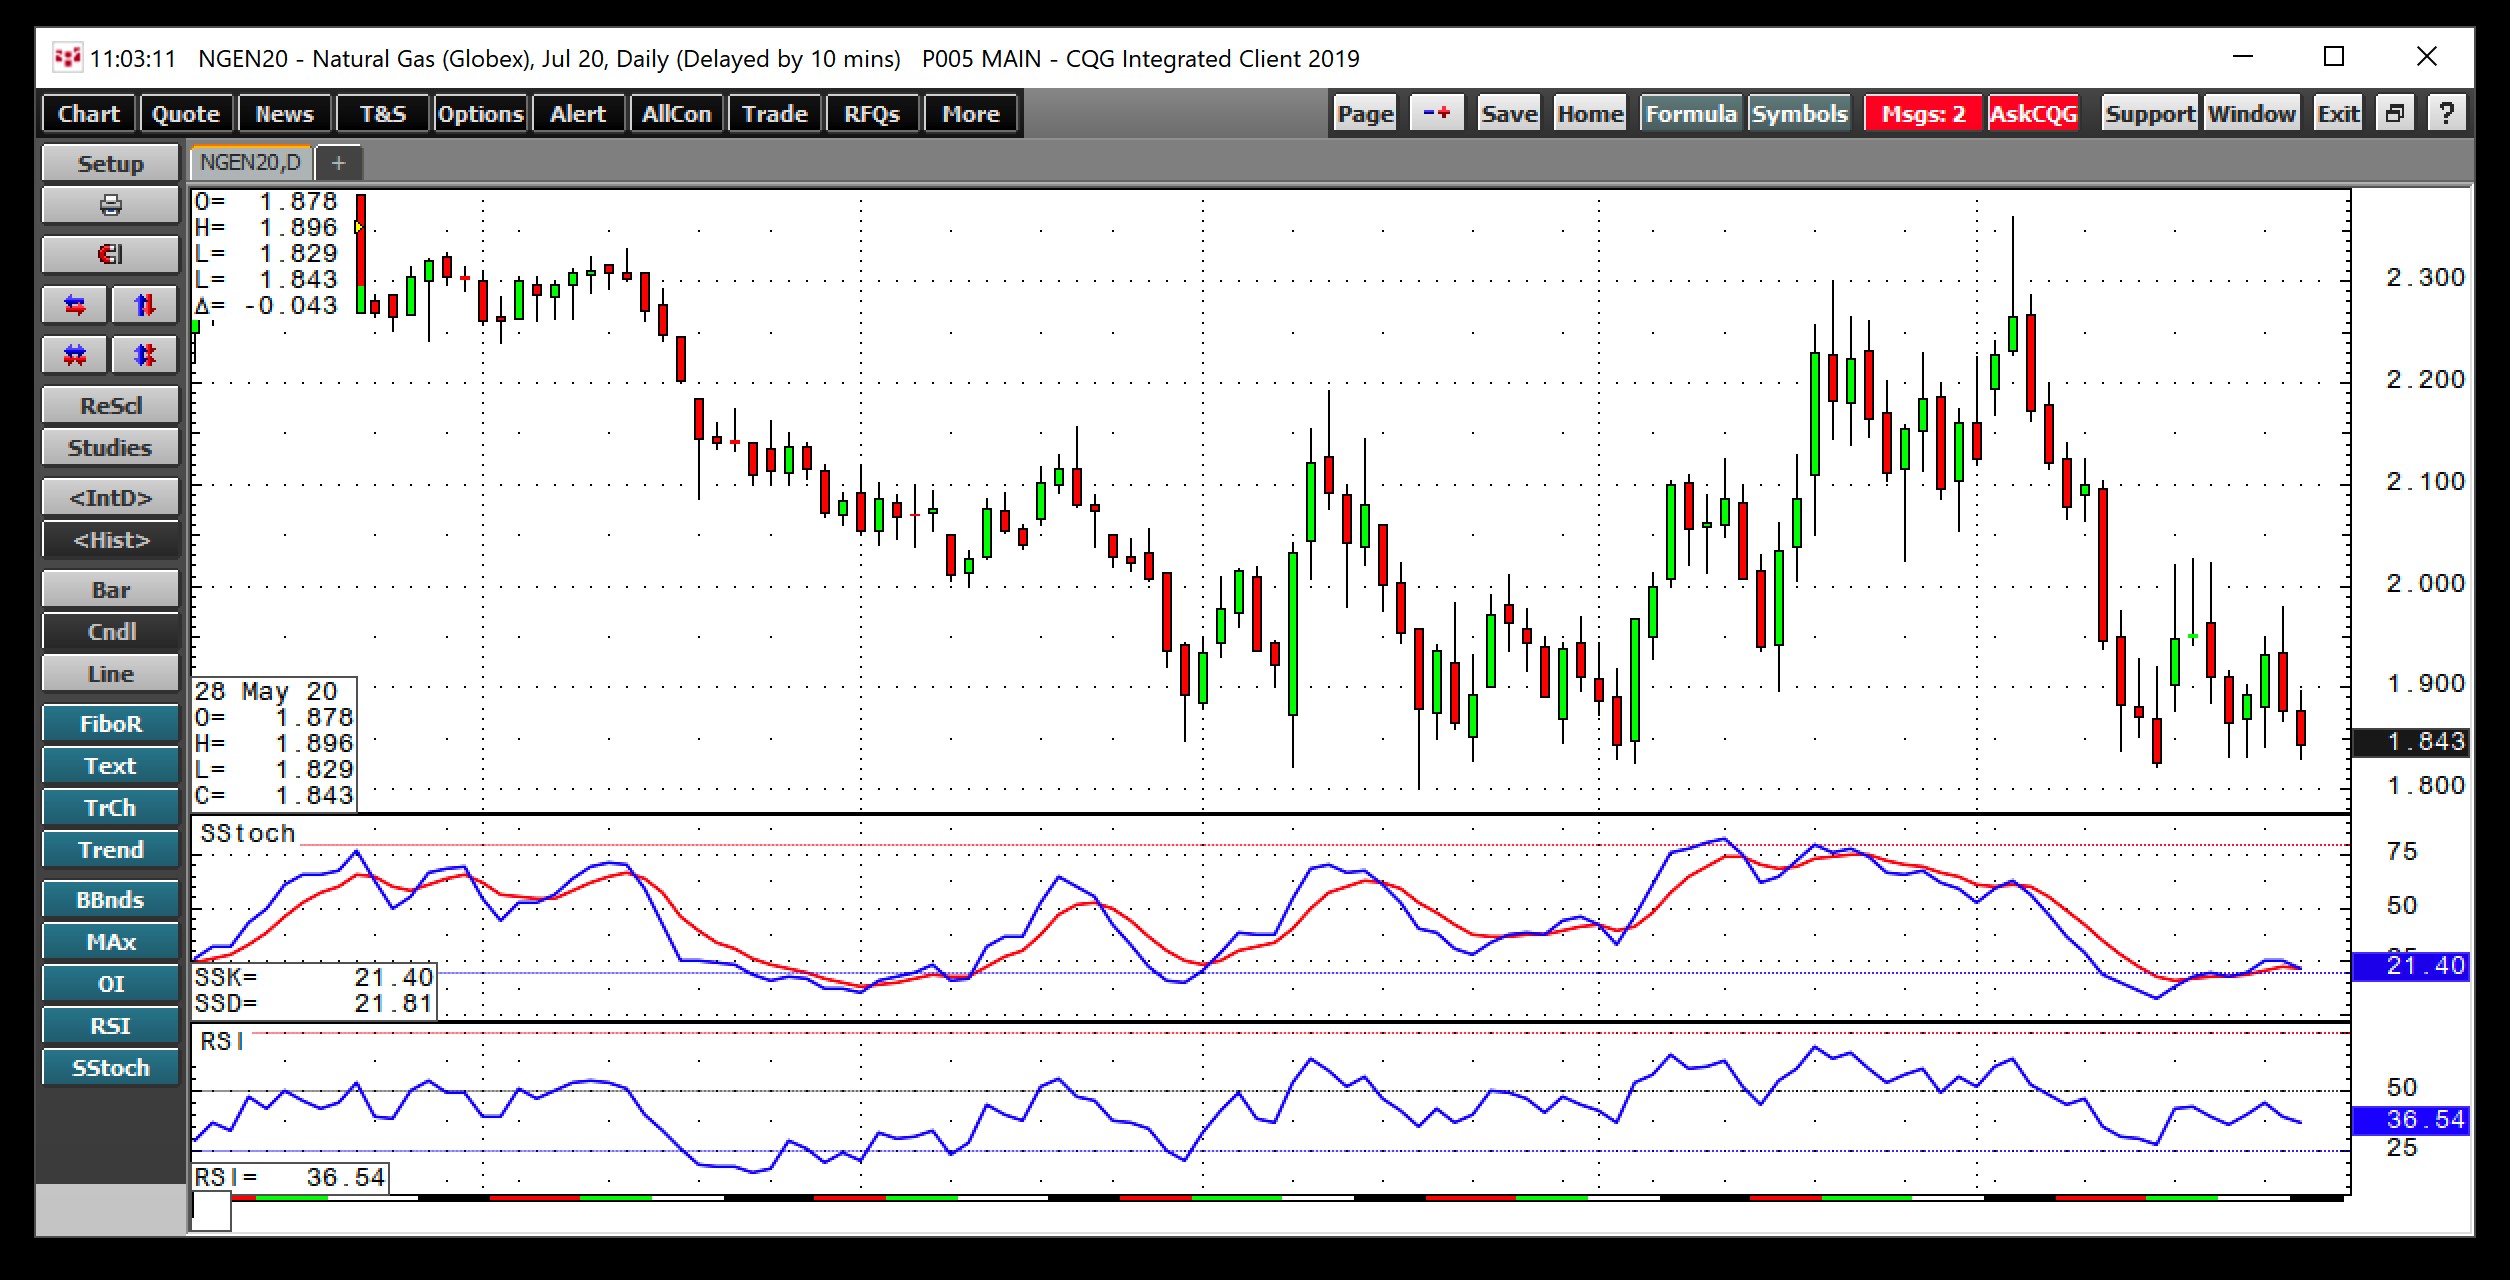
The price of June futures in the natural gas market rose to a high of $2.162 per MMBtu on May 5, which stands as the level of technical resistance on the continuous contract chart. However, the now active month July contract reached $2.364 on that day, 20.2 cents per MMBtu higher.

(Source: CQG)
After the rise to the May 5 peak, the price corrected to a low of $1.822 on May 15. Critical support on the July contract stands at the mid-March low at $1.802 per MMBtu. July’s premium and the contango in the natural gas market is a function of expectations for rising demand for air conditioning during the summer months and high inventory levels, creating a contango in the market where nearby prices are lower than deferred prices.
The July chart shows an oversold condition in both relative strength and price momentum. Natural gas has bounced from the current level at below $1.85 on the July contract each time since mid-March. Now that July is the active month, we will see if it can do it again after an inventory report that was slightly bearish on May 28.
