Yellow lights may not signal that a driver should slam on the brakes. On the other hand, anyone who has ever pushed the pedal to the floor to make it through an intersection has been burned by a speeding ticket - or three.
Similarly, when warning signs appear, investors should not abandon every exchange-traded asset in their vehicle. Yet ignoring significant impediments to sustainable price appreciation is likely to cause emotional stress at best and undesirable financial hardship at worst.
A week ago, I gave readers and listeners 3 ETFs for tracking the probability of a market correction. And while these indicators are by no means intended to predict the future, they are intended to provide insight for evaluating risks relative to rewards.
For those who may not wish to review my commentary in its entirety, the ETFs included Proshares Ultra Short Euro (EUO), PowerShares S&P 500 Low Volatility (SPLV) and iShares DJ Home Construction (ITB). With respect to EUO over the last week, it climbed significantly above its 50-day moving average, clearly indicating that the euro-zone, its currency and its ongoing debt crisis may thwart stock advances. Similarly, the SPLV:SPY price ratio continues to rise further above a 50-day trendline, demonstrating greater relative strength for defensive stocks like staples, health care and utilities. Even ITB is struggling to stay atop its 50-day.
In spite of these 3 indicators hinting that a more substantive pullback may grip equities, the S&P 500 still sits near 1510 at the mid-point of the trading day (2/27). That’s roughly a single percentage point below 2013 highs. In my estimation, however, it will be very difficult for U.S. stocks to scale the increasing number of worries on the wall without first experiencing an anxiety-riddled sell-off.
Here, then, are 2 more ETF indicators that you may wish to follow.
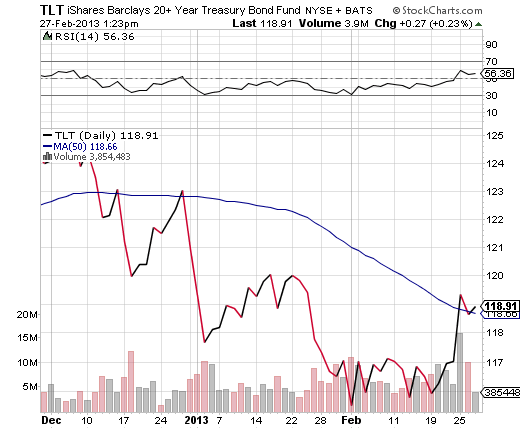
1. iShares Barclays 20+ Year Treasury (TLT). At the end of January, nearly every financial web site and nearly every important financial news source discussed the “Great Rotation.” In brief, investors were leaving bond funds for the sunnier shores of stock funds. What’s more, one would now have to contend with bond price depreciation if they made the mistake of sticking around. After all, the 30-year bond bull was officially over.
On the one hand, I have not been interested in owning long-dated treasuries because the yield barely compensates one for the risk of participation. Moreover, the idea of seeking price gains in treasuries tends to fly in the face of why one owns an income investment. On the flip side, the “Great Rotation” may not only be vastly overstated, it may be exceptionally misleading. Not only is the Fed actively engaged in purchasing U.S. debt to depress interest rates, but euro-zone woes as well as the U.S. sequester are likely to bolster demand.
It follows that iShares Barclays 20+ Year Treasury (TLT) still has the “mojo” to tell us when riskier assets might wane. For example, if TLT climbs above and holds above a 50-day trendline, near-term risk of stock market participation may be elevated.
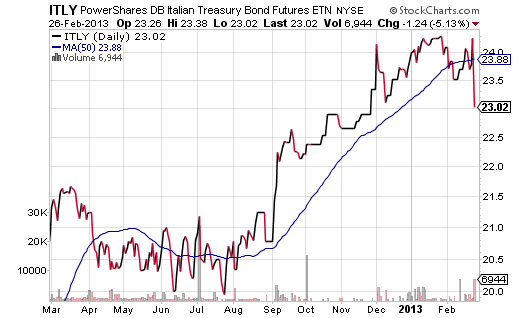
2. PowerShares DB Italian Treasury Bond ETN (ITLY). This morning, I read a tweet that admonished those who were making a mountain of Italy’s molehill. From the perspective of the angry tweeter, Italian bond yields are no higher than they were a few months ago… so why all the hoopla?
What the author fails to realize, however, is that trends are what make or break bull markets. For example, if China’s economic growth trends from 10% to 9% to 7.5%, its stock market fears the direction of the trend more than it is capable of embracing an absolute GDP number. Similarly, if the U.S. experiences genuine improvement in the jobs picture in 2013, the U.S. stock market may struggle with the possibility of a trend shift from loose monetary policy to tighter monetary policy.
So essentially, we are more interested in rising Italian bond yields (falling government bond prices) than the absolute price/yield. If PowerShares DB Italian Treasury Bond ETN (ITLY) continues to deteriorate further and further below key moving averages, you are likely to see volatile price swings in stocks — both domestic and abroad. 
Disclosure: Gary Gordon, MS, CFP is the president of Pacific Park Financial, Inc., a Registered Investment Adviser with the SEC. Gary Gordon, Pacific Park Financial, Inc, and/or its clients may hold positions in the ETFs, mutual funds, and/or any investment asset mentioned above. The commentary does not constitute individualized investment advice. The opinions offered herein are not personalized recommendations to buy, sell or hold securities. At times, issuers of exchange-traded products compensate Pacific Park Financial, Inc. or its subsidiaries for advertising at the ETF Expert web site. ETF Expert content is created independently of any advertising relationships.
- English (UK)
- English (India)
- English (Canada)
- English (Australia)
- English (South Africa)
- English (Philippines)
- English (Nigeria)
- Deutsch
- Español (España)
- Español (México)
- Français
- Italiano
- Nederlands
- Português (Portugal)
- Polski
- Português (Brasil)
- Русский
- Türkçe
- العربية
- Ελληνικά
- Svenska
- Suomi
- עברית
- 日本語
- 한국어
- 简体中文
- 繁體中文
- Bahasa Indonesia
- Bahasa Melayu
- ไทย
- Tiếng Việt
- हिंदी
2 Additional ETF Trends Flash Yellow Warning Signs
Published 02/28/2013, 02:15 AM
2 Additional ETF Trends Flash Yellow Warning Signs
Latest comments
Loading next article…
Install Our App
Risk Disclosure: Trading in financial instruments and/or cryptocurrencies involves high risks including the risk of losing some, or all, of your investment amount, and may not be suitable for all investors. Prices of cryptocurrencies are extremely volatile and may be affected by external factors such as financial, regulatory or political events. Trading on margin increases the financial risks.
Before deciding to trade in financial instrument or cryptocurrencies you should be fully informed of the risks and costs associated with trading the financial markets, carefully consider your investment objectives, level of experience, and risk appetite, and seek professional advice where needed.
Fusion Media would like to remind you that the data contained in this website is not necessarily real-time nor accurate. The data and prices on the website are not necessarily provided by any market or exchange, but may be provided by market makers, and so prices may not be accurate and may differ from the actual price at any given market, meaning prices are indicative and not appropriate for trading purposes. Fusion Media and any provider of the data contained in this website will not accept liability for any loss or damage as a result of your trading, or your reliance on the information contained within this website.
It is prohibited to use, store, reproduce, display, modify, transmit or distribute the data contained in this website without the explicit prior written permission of Fusion Media and/or the data provider. All intellectual property rights are reserved by the providers and/or the exchange providing the data contained in this website.
Fusion Media may be compensated by the advertisers that appear on the website, based on your interaction with the advertisements or advertisers.
© 2007-2025 - Fusion Media Limited. All Rights Reserved.
