Some volatility trading systems use intra-day open, high, low (OHL) prices as part of their algorithms for determining when to trade. UVXY and SVXY didn’t start trading until late 2011—just after the 2011 correction and well past the 2008/2009 bear market so there’s no actual trade data from those important downturns.
To fill that deficiency, I did some simulations a few years ago using the OHL values of VIX Futures to calculate OHL data for many of the volatility Exchange Traded Products (ETPs) including UVXY and SVXY.
The Freaky Fifth of February
The events of February 5th, 2018 caused a death and some changes. In addition to XIV’s termination by Credit Suisse due to its losses that day, ProShares decided to reduce the leverage factors on UVXY and SVXY. Those leverage changes took effect the 28th of February, 2018.
UVXY and SVXY’s ticker symbols did not change so the publically available OHLC data is a mix of the old 2X and -1X and new 1.5X and -0.5X leverage factors—the data before February 28, 2018, only applies to the discontinued leverage factors. For people wanting to do simulations on the new funds based on historical data, this is a problem. To address this need I did simulations for the 1.5X UVXY and -0.5X SVXY to generate the OHLC data from March 2004 through March 2018—these are available at the bottom of this post and here.
The New IV Close Values
Generating the simulated Indicative Value (IV), the ~4:15 PM ET close values for the new 1.5X UVXY and -0.5X SVXY was straightforward, I adjusted the appropriate multipliers in the algorithms and used the official VIX futures settlement values as inputs into the calculations. The resulting IV Close results match closely (within +-0.15%) to the values published by ProShares on the web pages for UVXY and SVXY.
Generating Open/High/Low data for the Reduced Leverage UVXY & SVXY ETPs
Using the combination of the OHL for the original funds and reduced leverage IV close values, I generated simulated OHL data for the reduced leveraged funds.
The process I used was relatively straightforward. I assume that for the 1.5X leveraged UVXY the intraday percentage moves from the previous day’s IV close would be reduced by ratio of the leverage changes (1.5/2 or 0.75 for UVXY). For example, if the old UVXY open was 3% higher than the previous day’s IV close the simulated open for the new 1.5X fund would be 2.25% higher than the previous 1.5X UVXY IV close. See the end of the post for an example equation.
Using the same approach, the new SVXY open values would be 50% (0.5/1.0) of the old SVXY’s OHL opening percentage moves relative to the previous day’s closing IV value. This same calculation was used for computing the intraday high and low values.
The source OHLC data that I use starts in March 2004 and has a major transition on 28-Oct-2013. On the October 2013 date, I switched from using VIX futures to simulate the OHL values to using the publicly available trade data. On the October date, the CBOE extended the trading hours of the VIX futures to the extent that they were no longer a good proxy for the normal NYSE trading hours. See this post for a detailed discussion on why I made the transition and the various uncertainties involved.
The 4 PM “Fake Close”
With historic trade data, there is also a “close” price in addition to the open/high low data. This close number is the last trade before or at the 4 PM market close of the equity markets—however, SVXY and UVXY official close isn’t until around 4:15 PM ET when their underlying securities, the two next to expire VIX futures settle.
Most brokers disseminate the 4 PM number as the “Close.” This causes no end of confusion—I’ll call this 4 PM close the “Fake Close” (FC). Often there are significant moves in the volatility markets in the remaining 15 minutes of trading—which can result in big differences between the Fake close and the IV close values. The leveraged ETPs rebalance is based on the IV close values so if you use the FC value for your calculations you will often conclude that the ETPs are not moving with the correct leverage the next day (see If you think your ETP is broken ).
While the Fake close generates confusion it does have one redeeming quality—it gives us one more piece of intraday data at an interesting time.
Action at the End
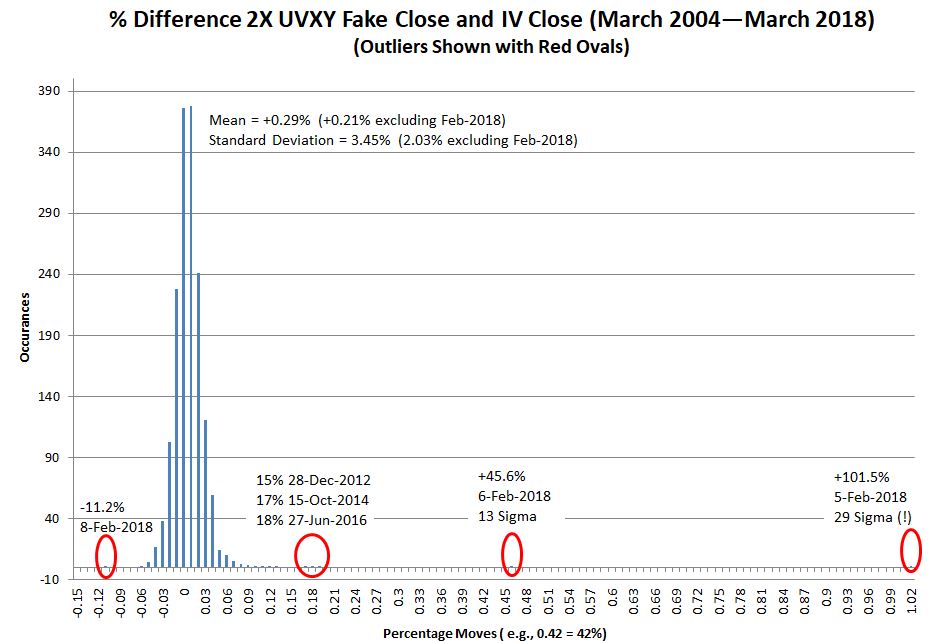
The Fake close allows us to better characterize the last 15 minutes of trading—on days with big volatility moves there is often a lot of action in this time window. The graph below shows the historical UVXY percentage moves in the 15 minutes from Fake close to the IV close.

The 102% move on 5-Feb-2108 was a 29 sigma move—a good indicator that assuming a normal distribution for UXVY day end percentage moves is a really bad idea. For more on outsize sigma moves see: Not All High Sigma Events are Black Swans.
Revised Daily High and Low Numbers
The publicly available trade data assumes that trading stops at 4 PM, so the stated high and low data may be inaccurate—because new lows and highs can be reached in the last 15 minutes of trading (and often are). In my simulation, if the IV close is lower than the trading low or higher than the trading high I set the intraday lows and highs to the IV close value as appropriate. Of course, the prices may have moved to higher highs or lower lows than the IV close during those 15 minutes but that trade data is not freely available.
Adjusting the February 5, 2018 data
Using old UVXY & SVXY OHLC data to generate simulated values for the new 1.5X and 0.5X funds is defendable for every day from March 26th, 2004 through February 27th, 2018– except for February 5th, 2018.
On that day the VIX set a new one day close-to-close record with a +116% jump (the previous highest was +62%) and the mix of VIX futures that UVXY and SVXY track (index SPVXSP) jumped +96% (the previous highest jump was +33%). I won’t go into the details, I’ll defer that to another post but the bottom line is that the managers of UVXY and SVXY correctly predicted that the end of day settlement for VIX Futures would be the apex of a liquidity crisis and chose to buy VIX futures to do their required rebalancing before the VIX Futures closed. This meant that the funds ‘performance likely would not track their target index but in the end, counterintuitively, saved both the 2X long and -1X inverse shareholders money.
In an alternative universe, had the reduced leverage 1.5X UVXY and -0.5X SVXY been trading on February 5th the fund managers would probably not have started early with their rebalancing so my simulation used actual VIX futures settlement values to simulate the end of day values on February 5th, 2018 for the lower leverage funds.
Conclusion
An important lesson, illustrated by the February 2018 travails of XIV and SVXY, is that when you’re testing trading strategies, you shouldn’t assume that past relationships (e.g., VIX percentage moves relative to VIX Futures percentage moves). will hold in the future. It’s critical to ask what can happen, especially when systems are highly stressed. It’s not enough to just look at the past.
Example Conversion Equation
New_Openday = New_IV_Closeday-1* (1+1.5/2.0*(Old_Openday / Old_Closeday-1 -1))
Where: New = 1.5X UVXY
Old = 2X UVXY
Please email me at vh2solutions@gmail.com if you have problems, questions, or requests.
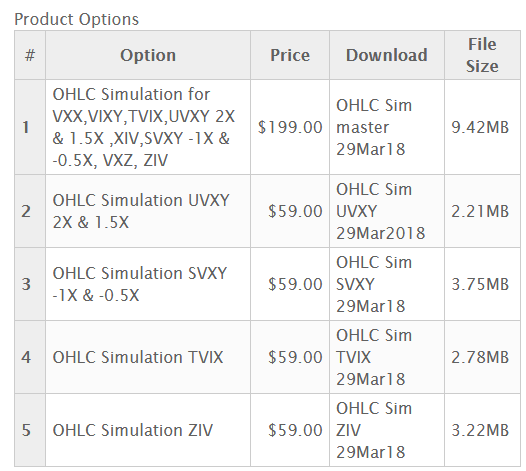
SkuSFI-ETP-OHL-New-LeverageDescriptionOHLC Simulation of 1.5X UVXY & SVXY from March 2004Product Options.

