
Today I'm focusing on dividend stocks with the high market sentiment on the market. I used the S&P 500 High Beta Index for the stock ideas. The index covers 100 stocks from the broad S&P 500 with the highest sensitivity to market movements over the past 12 months. The beta ratio is the main valuation driver.
Exactly 71 companies from the S&P 500 High Beta Index pay an actual dividend. I wanted to know which of them are really cheap, at least for now. Because there are 52 stocks with a low forward P/E, I selected only those high beta stocks with a very low forward price ratio. 15 have a forward P/E of less than 10; 13 of them are currently recommended to buy. You can find a list of the results below:
Freeport-McMoRan Copper & Gold (FCX) has a market capitalization of $26.80 billion. The company employs 34,000 people, generates revenue of $18.010 billion and has a net income of $3.977 billion. Freeport-McMoRan Copper & Gold’s earnings before interest, taxes, depreciation and amortization (EBITDA) amounts to $6.927 billion. The EBITDA margin is 38.46 percent (the operating margin is 31.35 percent and the net profit margin 22.08 percent).
Financial Analysis: The total debt represents 9.95 percent of Freeport-McMoRan Copper & Gold’s assets and the total debt in relation to the equity amounts to 20.10 percent. Due to the financial situation, a return on equity of 18.33 percent was realized by Freeport-McMoRan Copper & Gold. Twelve trailing months earnings per share reached a value of $2.81. Last fiscal year, Freeport-McMoRan Copper & Gold paid $1.25 in the form of dividends to shareholders. Forward P/E: 8.55.
Market Valuation: Here are the price ratios of the company: The P/E ratio is 10.03, the P/S ratio is 1.49 and the P/B ratio is finally 1.53. The dividend yield amounts to 4.43 percent and the beta ratio has a value of 1.99.
Seagate Technology (STX) has a market capitalization of $14.81 billion. The company employs 57,900 people, generates revenue of $14.351 billion and has a net income of $1.838 billion. Seagate Technology’s earnings before interest, taxes, depreciation and amortization (EBITDA) amounts to $2.966 billion. The EBITDA margin is 20.67 percent (the operating margin is 14.57 percent and the net profit margin 12.81 percent).
Financial Analysis: The total debt represents 30.04 percent of Seagate Technology’s assets and the total debt in relation to the equity amounts to 79.21 percent. Due to the financial situation, a return on equity of 52.49 percent was realized by Seagate Technology. Twelve trailing months earnings per share reached a value of $4.81. Last fiscal year, Seagate Technology paid $1.40 in the form of dividends to shareholders. Forward P/E: 7.04.
Market Valuation: Here are the price ratios of the company: The P/E ratio is 8.57, the P/S ratio is 1.03 and the P/B ratio is finally 4.22. The dividend yield amounts to 3.68 percent and the beta ratio has a value of 2.43.
ENSCO (ESV) has a market capitalization of $13.44 billion. The company employs 9,000 people, generates revenue of $4.300 billion and has a net income of $1.222 billion. ENSCO’s earnings before interest, taxes, depreciation and amortization (EBITDA) amounts to $2.150 billion. The EBITDA margin is 50.01 percent (the operating margin is 36.39 percent and the net profit margin 28.42 percent).
Financial Analysis: The total debt represents 26.10 percent of ENSCO’s assets and the total debt in relation to the equity amounts to 40.91 percent. Due to the financial situation, a return on equity of 10.59 percent was realized by ENSCO. Twelve trailing months earnings per share reached a value of $5.40. Last fiscal year, ENSCO paid $1.50 in the form of dividends to shareholders. Forward P/E: 7.51.
Market Valuation: Here are the price ratios of the company: The P/E ratio is 10.68, the P/S ratio is 3.12 and the P/B ratio is finally 1.13. The dividend yield amounts to 3.47 percent and the beta ratio has a value of 1.44.
Here is the performance review:
Take a closer look at the full list of the cheapest high beta stocks from the S&P High Beta index. The average P/E ratio amounts to 17.44 and forward P/E ratio is 8.52. The dividend yield has a value of 2.07 percent. Price to book ratio is 1.61 and price to sales ratio 1.25. The operating margin amounts to 18.41 percent and the beta ratio is 2.04. Stocks from the list have an average debt to equity ratio of 0.61. Below the results are many technology, financials and basic material stocks. These 3 sectors are full of high beta stocks with a very low valuation. But beware; the low valuation can also be an expression for a decreasing income that the market anticipates in the future. 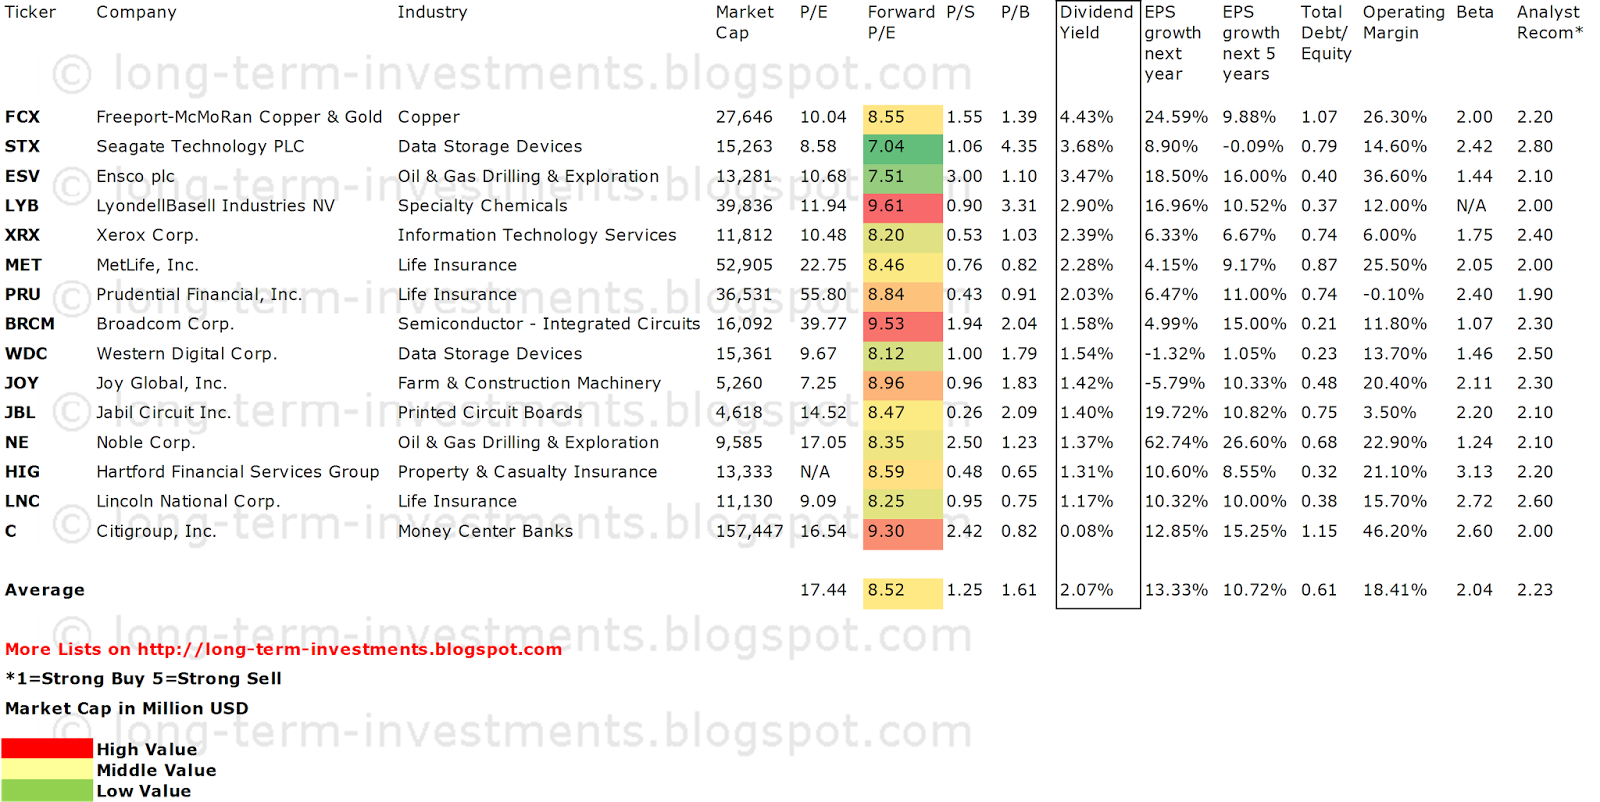
Related Stock Ticker Symbols: FCX, STX, ESV, LYB, XRX, MET, PRU, BRCM, WDC, JOY, JBL, NE, HIG, LNC, C
Disclosure: I have no positions in any stocks mentioned, and no plans to initiate any positions within the next 72 hours. I receive no compensation to write about any specific stock, sector or theme.
- English (UK)
- English (India)
- English (Canada)
- English (Australia)
- English (South Africa)
- English (Philippines)
- English (Nigeria)
- Deutsch
- Español (España)
- Español (México)
- Français
- Italiano
- Nederlands
- Português (Portugal)
- Polski
- Português (Brasil)
- Русский
- Türkçe
- العربية
- Ελληνικά
- Svenska
- Suomi
- עברית
- 日本語
- 한국어
- 简体中文
- 繁體中文
- Bahasa Indonesia
- Bahasa Melayu
- ไทย
- Tiếng Việt
- हिंदी
15 High Beta Dividend Stocks With Low Market Valuations
Published 07/31/2013, 05:44 AM
Updated 07/09/2023, 06:31 AM
15 High Beta Dividend Stocks With Low Market Valuations
Latest comments
Loading next article…
Install Our App
Risk Disclosure: Trading in financial instruments and/or cryptocurrencies involves high risks including the risk of losing some, or all, of your investment amount, and may not be suitable for all investors. Prices of cryptocurrencies are extremely volatile and may be affected by external factors such as financial, regulatory or political events. Trading on margin increases the financial risks.
Before deciding to trade in financial instrument or cryptocurrencies you should be fully informed of the risks and costs associated with trading the financial markets, carefully consider your investment objectives, level of experience, and risk appetite, and seek professional advice where needed.
Fusion Media would like to remind you that the data contained in this website is not necessarily real-time nor accurate. The data and prices on the website are not necessarily provided by any market or exchange, but may be provided by market makers, and so prices may not be accurate and may differ from the actual price at any given market, meaning prices are indicative and not appropriate for trading purposes. Fusion Media and any provider of the data contained in this website will not accept liability for any loss or damage as a result of your trading, or your reliance on the information contained within this website.
It is prohibited to use, store, reproduce, display, modify, transmit or distribute the data contained in this website without the explicit prior written permission of Fusion Media and/or the data provider. All intellectual property rights are reserved by the providers and/or the exchange providing the data contained in this website.
Fusion Media may be compensated by the advertisers that appear on the website, based on your interaction with the advertisements or advertisers.
© 2007-2025 - Fusion Media Limited. All Rights Reserved.