With a bearish structure on the weekly chart and potential H&S top on the daily, we’re looking for an eventual breakdown.

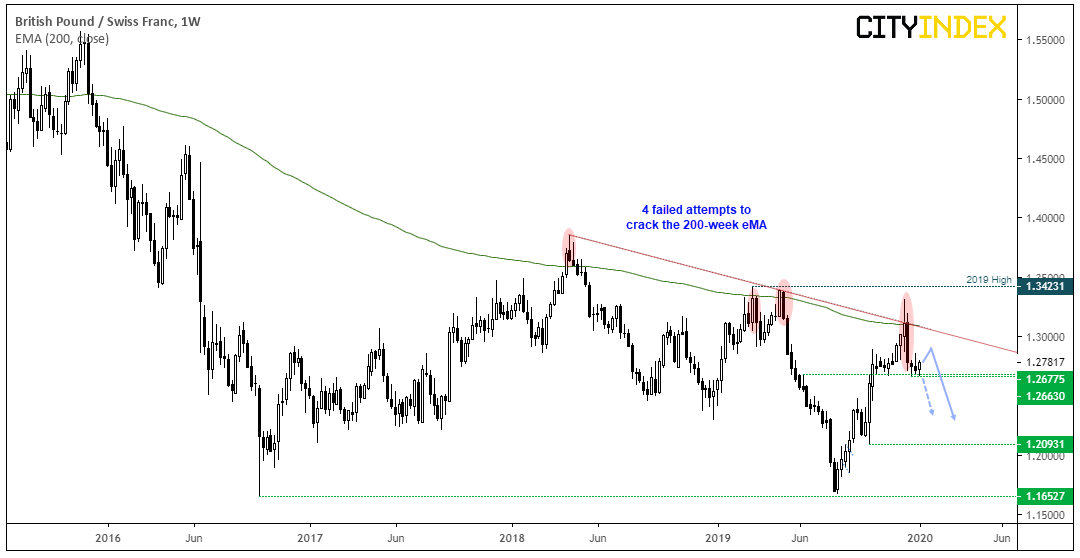
We can see on the weekly chart that GBP/CHF remains in a long-term bearish trend. There have also been four failed attempts to break above the 200-week eMA, with the most recent attempt being the week of the UK elections in December. Given the following week was a bearish engulfing candle and its most bearish in 5 months, it’s possible the market has topped.
However, we’d need to see a clear break of the 1.2660 before assuming trend continuation, which leaves it vulnerable to a bounce beforehand.

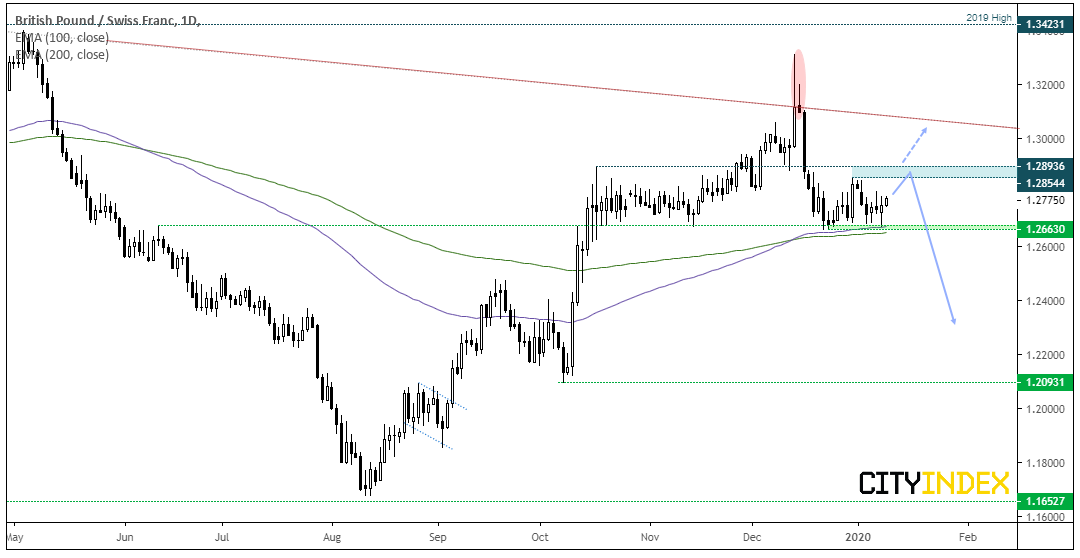
Switching to the daily chart, GBP/CHF has found support above the June high along with the 100 and 200-day eMA’s. With the 100 above the 200 eMA and sloping higher, there’s potential for a bounce over the near-term. Therefor bulls may want to consider trading the range and entering close to the lows around 1.2700 and target the zone of resistance around 1.2855 / 93.
However, if momentum wanes near the highs and signals price action is trying to top out, then bears could look to fade into moves below the resistance zone. Due to the bearish structure of the weekly chart, an eventual break lower is favoured. So we’re on the lookout for a break below 1.2600 as this would clear the current range and the 100 and 200-day eMA’s.

