11 Monster Stock Market Predictions For The Week Of Oct. 21

Published 10/21/2019, 01:15 AM
Updated 11/16/2024, 07:53 AM
BA
-
SPY
-
QQQ
-
AAPL
-
VZ
-
JNJ
-
NFLX
-
TSLA
-
OKTA
-
ROKU
-
ZS
-
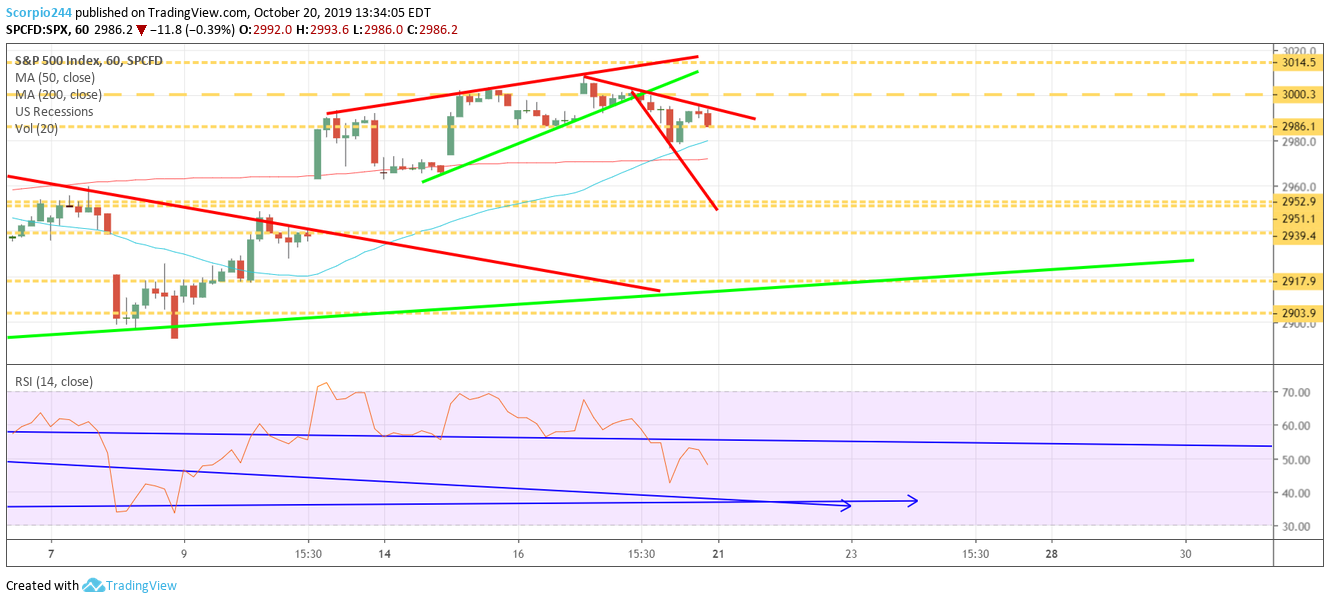
S&P 500 Index Chart
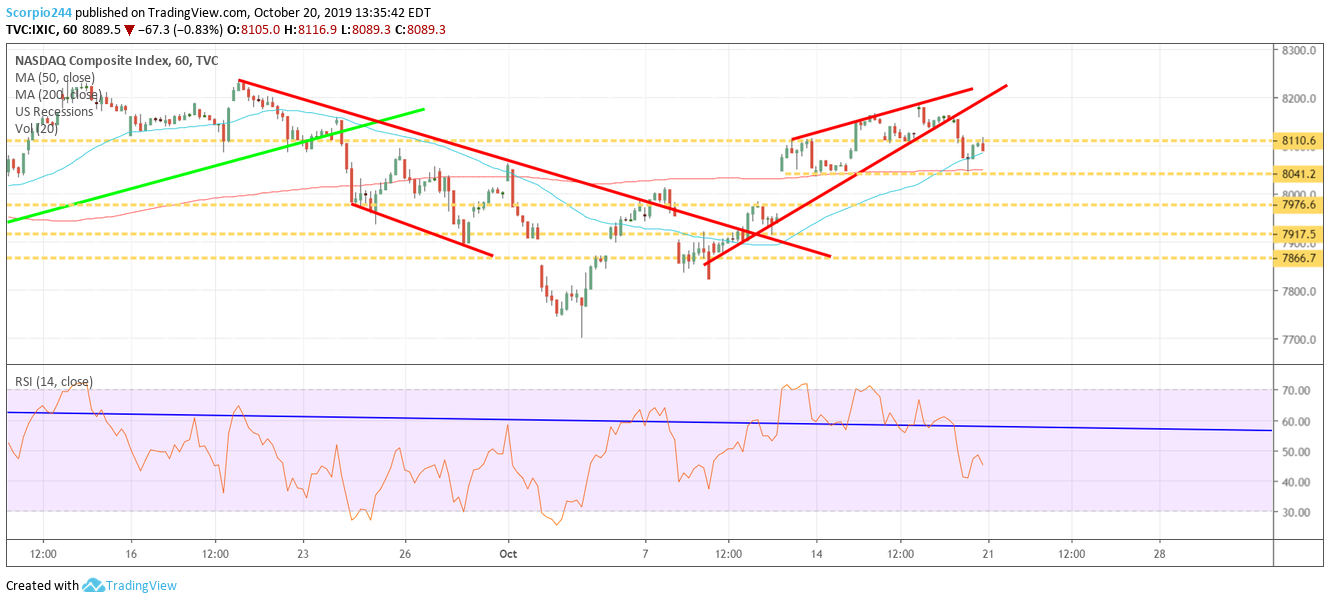
NASDAQ Composite Index Chart

Macro

S&P 500 (SPY)

The week of October 21 will be busy with earnings season in full effect. However, the market left off on Friday in a precarious spot and is likely to continue to move lower when it resumes on Monday. The S&P 500 trend has changed and has shifted lower, and that means the index may continue to decline towards 2965 or as low as 2940 to start this week.NASDAQ (QQQ)We can see the NASDAQ also struggled to regain positive momentum on Friday, failing at resistance around 8,110.

Stocks

Boeing (NYSE:BA)

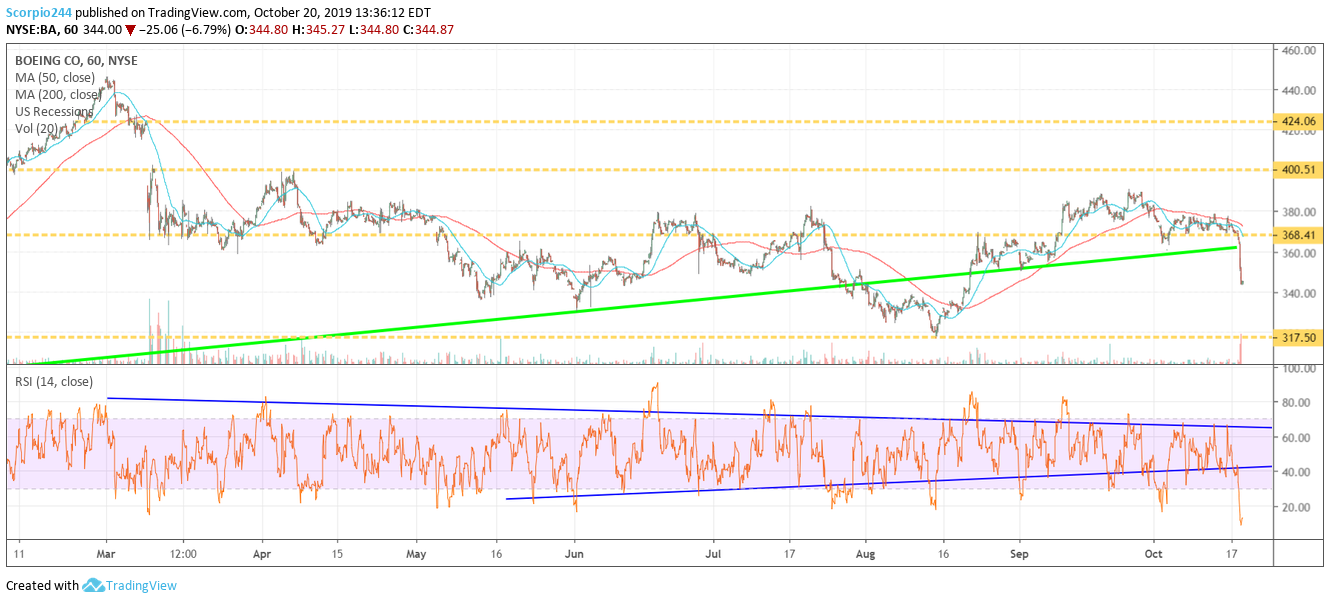
Boeing (NYSE:BA) fell apart on Friday, and it will put additional pressure on the company when they report results this week. The chart looks broken, and as I said to a subscriber mid-week, the stock looks like it could fall to $320. That was before Friday’s sell-off.
Boeing Co Chart

Johnson & Johnson (NYSE:JNJ)

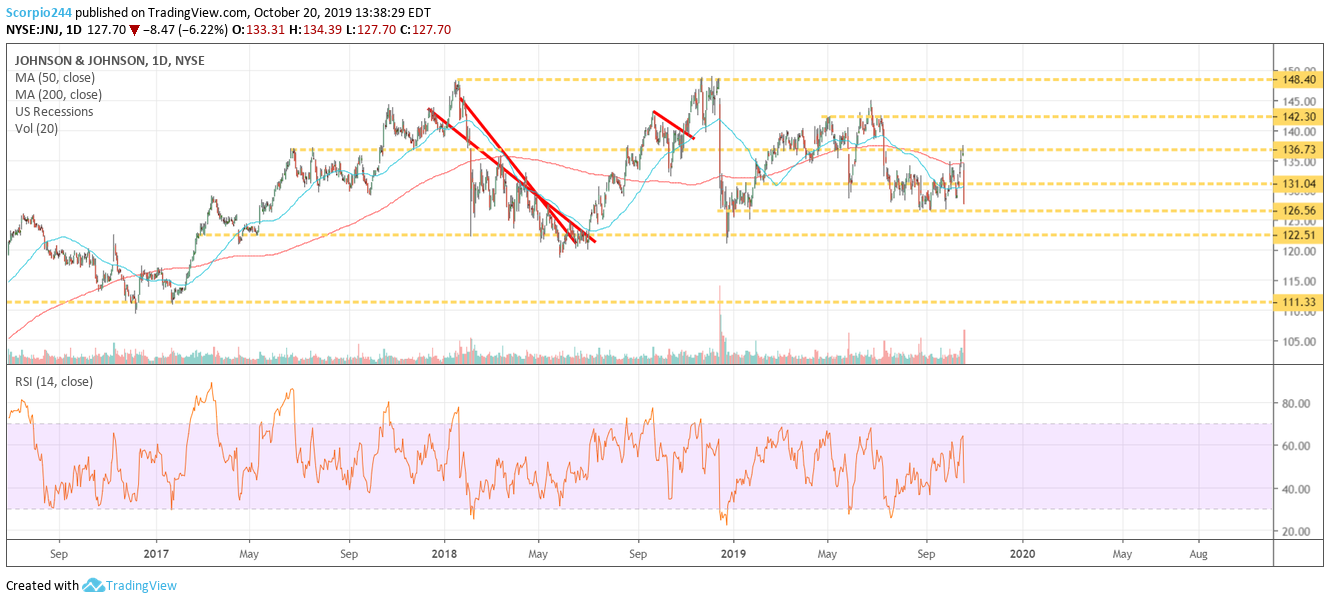
Johnson and Johnson Daily Chart

Johnson and Johnson has a ton headline risk now, and if the stock falls below $ 126.50, a move to $122 seems likely. But after $122 could mean a drop to $111.

Tesla (NASDAQ:TSLA)

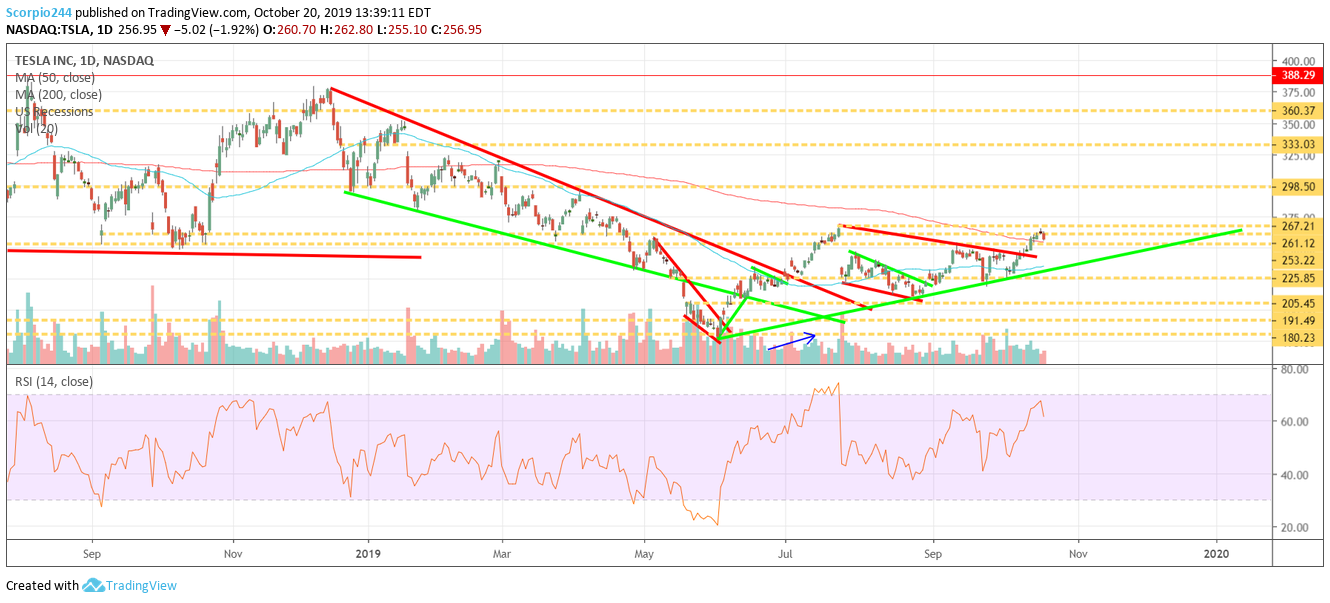
Tesla (NASDAQ:TSLA) has been rising steadily, but it has been unable to rise above $267 so far. It needs to rise above that level to push towards $300. I think this week it breaks out and that big push higher begins.
Tesla Inc Daily Chart

Verizon Communications (NYSE:VZ)

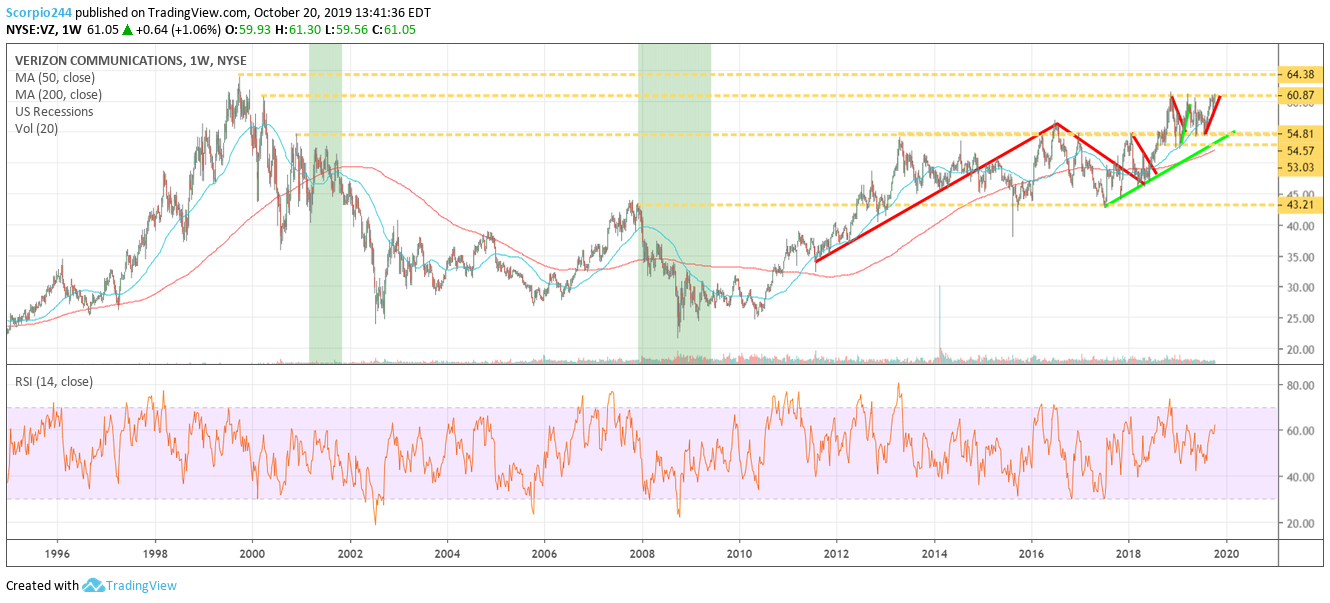
Verizon Weekly Chart

Verizon (NYSE:VZ) closed at its highest price since the year 2000, and now maybe heading to a record high at not seen since 1999.

Apple (NASDAQ:AAPL)

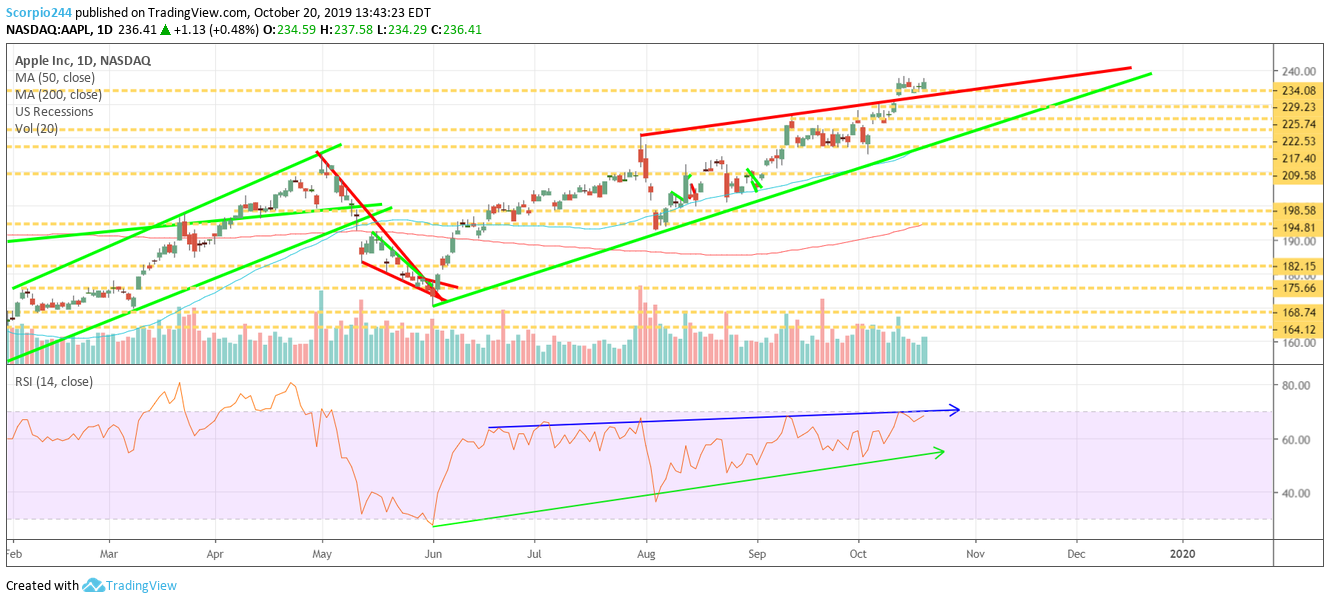
So much for Apple (NASDAQ:AAPL) falling as I thought. Now it seems to be getting ready for its push to $242.
Apple Daily Chart

Netflix (NASDAQ:NFLX)

Netflix Daily Chart

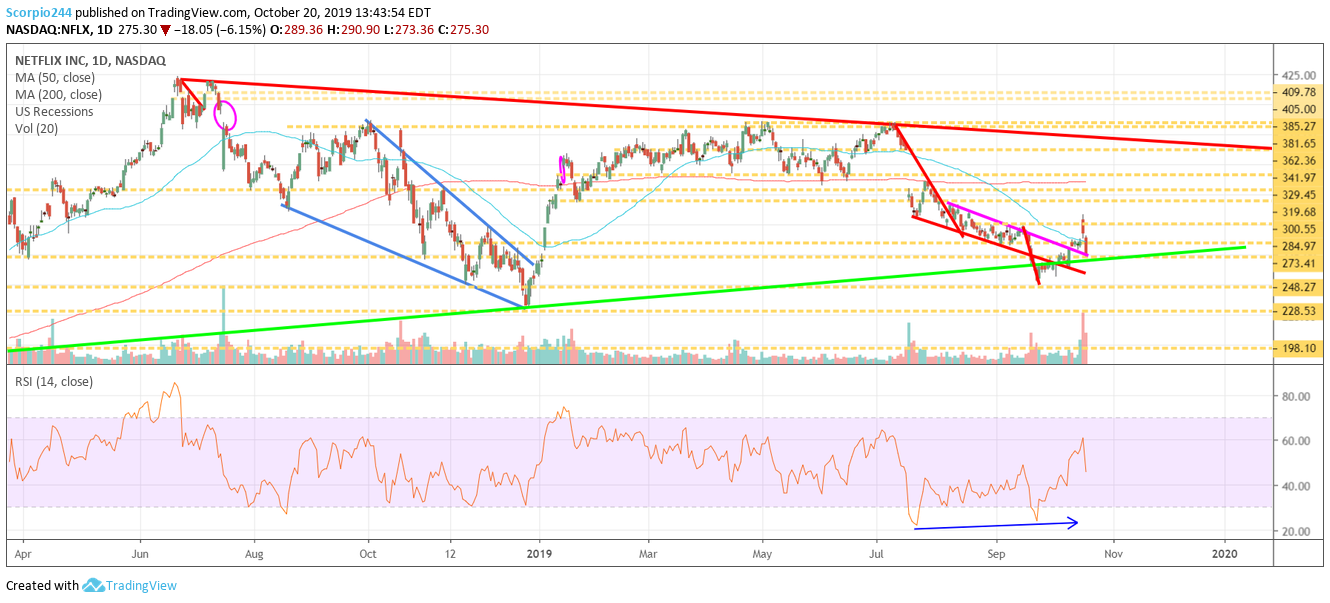
Netflix (NASDAQ:NFLX) tested and is holding the break out at $273, the trend higher continues with the stock pushing back to $320 this week.

Roku (NASDAQ:ROKU)
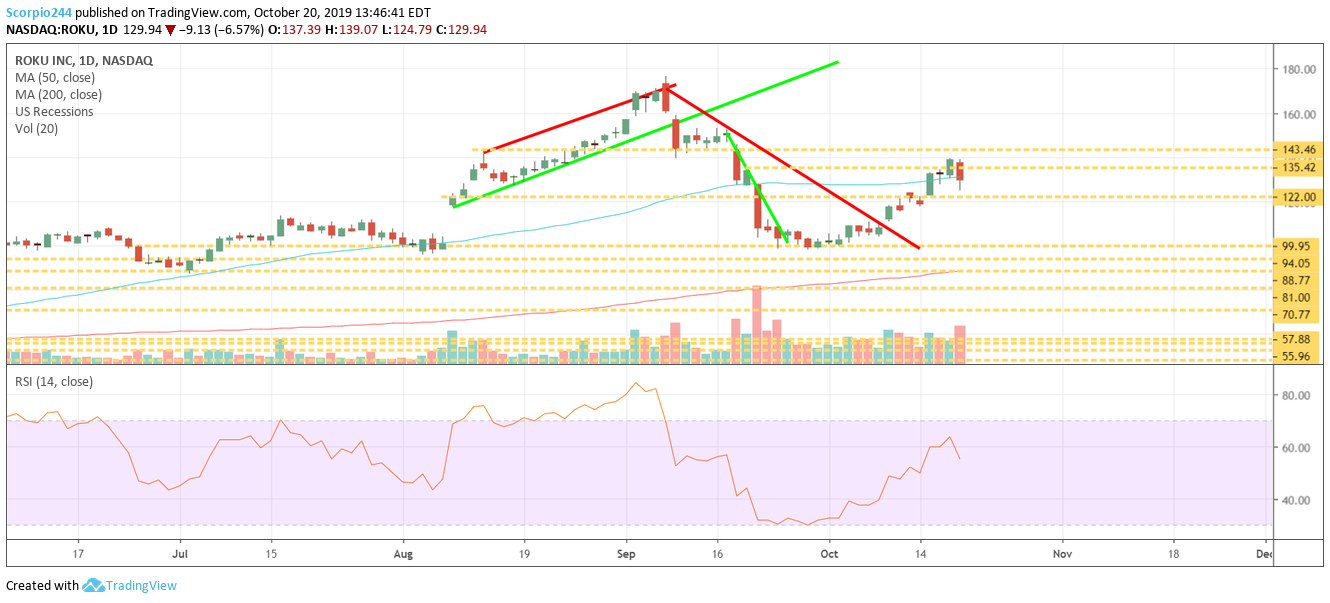
Roku Inc Daily Chart

Roku got back to and failed at resistance around $143. I think the stock continues to fall, dropping back to $122.

Okta (NASDAQ:OKTA)

The chart for OKTA does not look good, with a chance to push even lower towards $87.25.
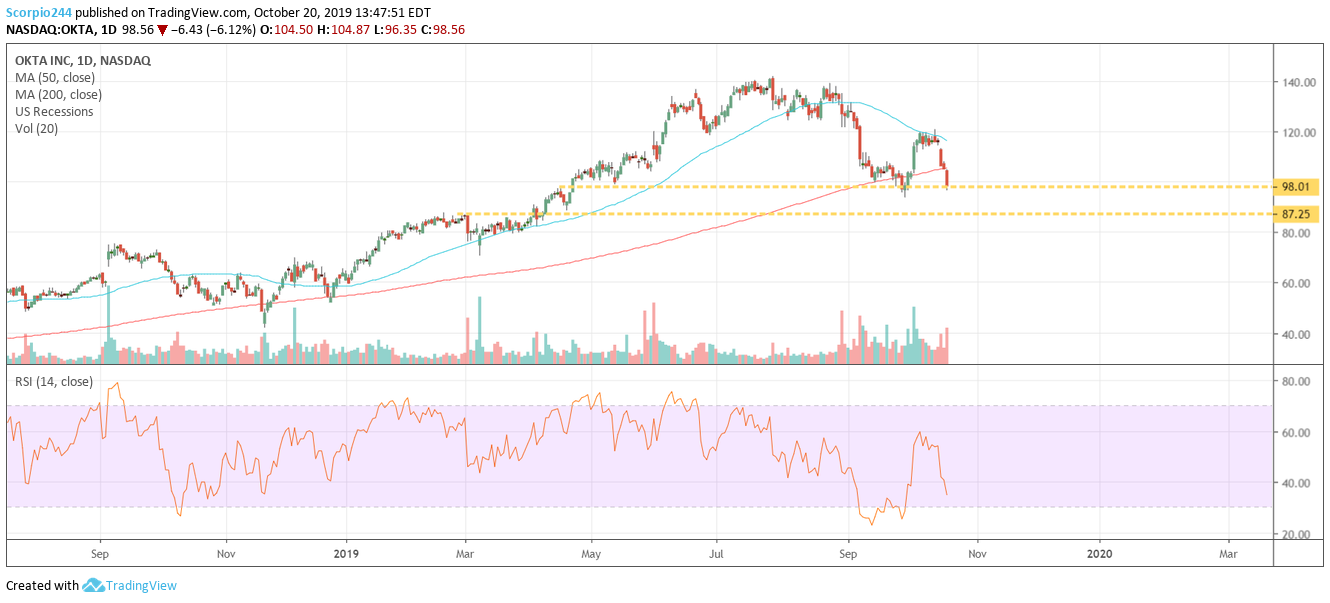
OKTA Daily Chart

Zscaler (NASDAQ:ZS)

Zscaler has to hold $42.70, or else $34.75 seems possible.
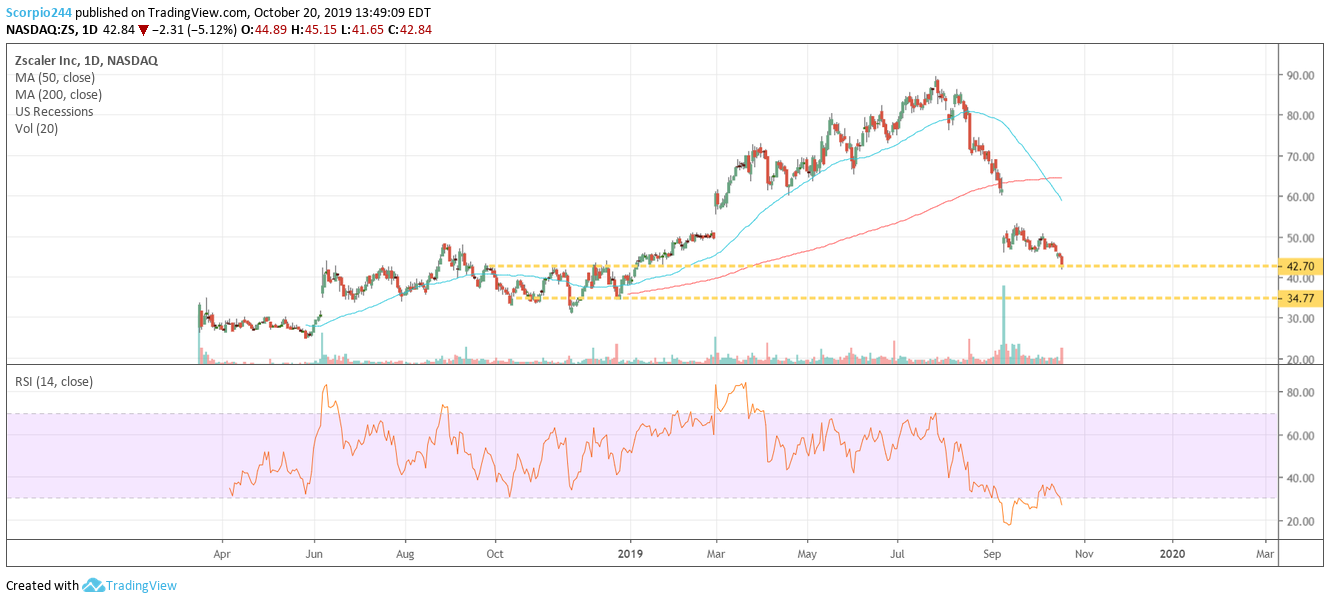
Zscaler Daily Chart

Original Post

Latest comments

Loading next article…
Risk Disclosure: Trading in financial instruments and/or cryptocurrencies involves high risks including the risk of losing some, or all, of your investment amount, and may not be suitable for all investors. Prices of cryptocurrencies are extremely volatile and may be affected by external factors such as financial, regulatory or political events. Trading on margin increases the financial risks.
Before deciding to trade in financial instrument or cryptocurrencies you should be fully informed of the risks and costs associated with trading the financial markets, carefully consider your investment objectives, level of experience, and risk appetite, and seek professional advice where needed.
Fusion Media would like to remind you that the data contained in this website is not necessarily real-time nor accurate. The data and prices on the website are not necessarily provided by any market or exchange, but may be provided by market makers, and so prices may not be accurate and may differ from the actual price at any given market, meaning prices are indicative and not appropriate for trading purposes. Fusion Media and any provider of the data contained in this website will not accept liability for any loss or damage as a result of your trading, or your reliance on the information contained within this website.
It is prohibited to use, store, reproduce, display, modify, transmit or distribute the data contained in this website without the explicit prior written permission of Fusion Media and/or the data provider. All intellectual property rights are reserved by the providers and/or the exchange providing the data contained in this website.
Fusion Media may be compensated by the advertisers that appear on the website, based on your interaction with the advertisements or advertisers.
© 2007-2025 - Fusion Media Limited. All Rights Reserved.