Investing.com’s stocks of the week
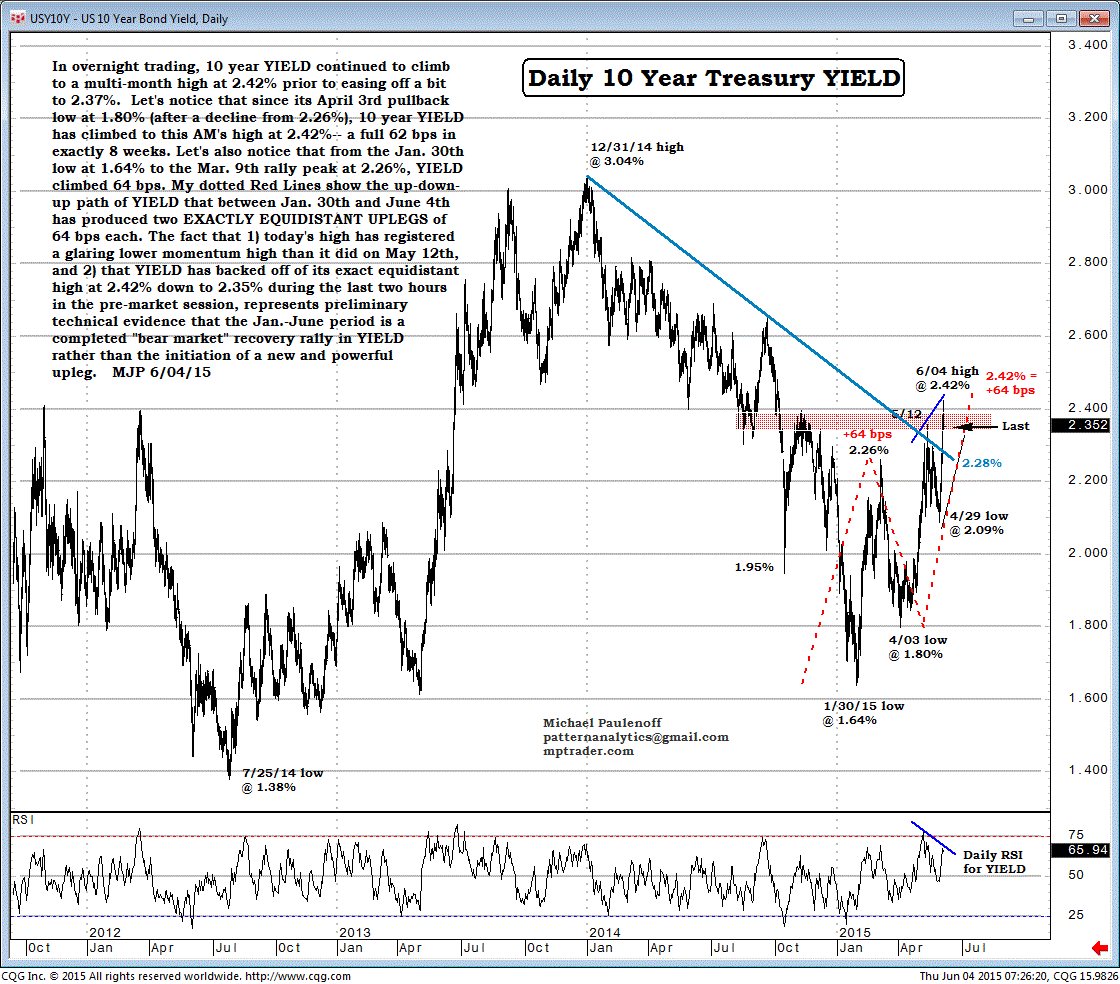
The U.S. 10-year YIELD continued to climb to a multi-month high at 2.42% prior to easing off a bit to 2.37%.
Let's notice that since its April 3 pullback low at 1.80% (after a decline from 2.26%), the 10-year YIELD climbed to Thursday morning’s high at 2.42% -- a full 62 bps in exactly 8 weeks.
Let's also notice that from the Jan. 30 low at 1.64% to the Mar. 9 rally peak at 2.26%, YIELD climbed 64 bps.
My dotted red lines on the chart show the up-down-up path of YIELD that between Jan. 30 and June 4 has produced two exactly equidistant uplegs of 64 bps each.
The fact that 1) today's high has registered a glaring lower-momentum high than it did on May 12 and 2) that YIELD has backed off of its exact equidistant high at 2.42%, down to 2.35% during the last two hours in the pre-market session, represents preliminary, technical evidence that the Jan.-Jun. period is a completed "bear-market" recovery rally in YIELD rather than the initiation of a new and powerful upleg.

