It appears that the S&P’s sideways trend may be preparing for what could turn out to be a very vicious sideways swipe down based on, interestingly, the charts of the 10-year Treasury yield that appears to be readying for another move down on what would be a decent round of risk-off.
Should this occur, a sideways swipe down in the S&P will not necessarily be “vicious” due to the degree of decline that it may cause but due to the fact that the index is close to a level that makes an upside break from the sideways trend seem possible, and thus a move back down into the 1267 to 1422 range could be psychologically tormenting to some.
Considering that the S&P’s charts have been analyzed frequently here around this possible move down, let’s turn to those that have not been marked here in weeks and those are of the 10-year Treasury yield. It appears to be readying for a solid move down and something that would be inverse to a potential move up in price for the flight to safety side of a potential round of risk-off.
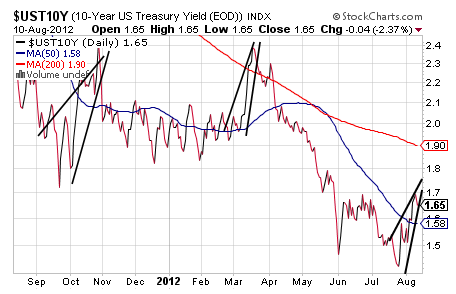
Specifically, the 10-year yield appears to be trading in a smaller version of the same pattern the S&P is trading in and that is none other than the bearish Rising Wedge with the last two having produced strong results even after the head-faking cross above the 50 DMA with the current pattern confirming at 1.60% for a target of 1.43%. But as is discussed here frequently, this is a tough pattern to track being of the bearish variety built of an uptrend.
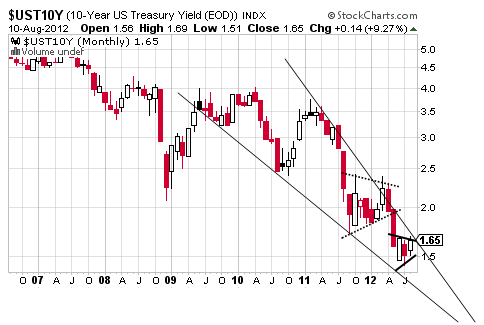
Naturally this is a good reason to cross-check its potential success even if after a peak out right above 1.70% this month against a longer-term month chart of the 10-year Treasury and this is interesting considering that it is showing a pattern that backs up May 11’s note Why the 10-Year Is Going Sub-1%.
As can be seen in the chart on the following page, the 10-year yield is fulfilling the Symmetrical Triangle outlined in that note to the downside through what appears to be a smaller Symmetrical Triangle that should break to the downside as well. Its less likely upside scenario confirms at 1.69% for a target of 1.95% while the downside case is a bit more dramatic with confirmation at 1.43% for an objective of – yes, this is for real – 0.43% to suggest that sideways may, in fact, turn out to be vicious in more ways than one.
Together these patterns would help to create a very powerful and bullish Falling Wedge with the difficulty of that pattern similar to the Rising Wedge but in inverse fashion and that means identifying the apex after some portion of the bounce back up has occurred. 
Based on the rendering above, it is unlikely to be south of 0.50%, but it will be sub-1% and sometimes these patterns go extreme so the full target of the smaller pattern should not be ruled out entirely.
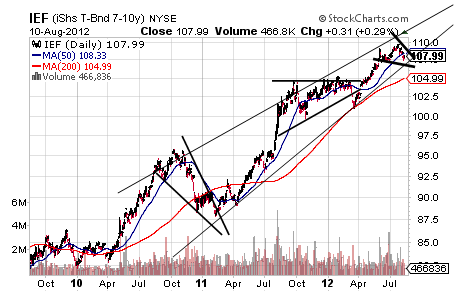
And just as one last check around what will be a stunning move in the 10-year Treasury through a 7- to 10-year Treasury ETF, it is trading in a very nice Rising Wedge but one that appears likely to find a higher apex yet and this is true of the more popular TLT too.
Overall, then, it does seem that the 10-year is still headed sub-1.0% on some risk-off.
- English (UK)
- English (India)
- English (Canada)
- English (Australia)
- English (South Africa)
- English (Philippines)
- English (Nigeria)
- Deutsch
- Español (España)
- Español (México)
- Français
- Italiano
- Nederlands
- Português (Portugal)
- Polski
- Português (Brasil)
- Русский
- Türkçe
- العربية
- Ελληνικά
- Svenska
- Suomi
- עברית
- 日本語
- 한국어
- 简体中文
- 繁體中文
- Bahasa Indonesia
- Bahasa Melayu
- ไทย
- Tiếng Việt
- हिंदी
10-Year Still Headed Sub-1% On A Round Risk-Off
Published 08/14/2012, 01:58 AM
Updated 07/09/2023, 06:31 AM
10-Year Still Headed Sub-1% On A Round Risk-Off
Latest comments
Loading next article…
Install Our App
Risk Disclosure: Trading in financial instruments and/or cryptocurrencies involves high risks including the risk of losing some, or all, of your investment amount, and may not be suitable for all investors. Prices of cryptocurrencies are extremely volatile and may be affected by external factors such as financial, regulatory or political events. Trading on margin increases the financial risks.
Before deciding to trade in financial instrument or cryptocurrencies you should be fully informed of the risks and costs associated with trading the financial markets, carefully consider your investment objectives, level of experience, and risk appetite, and seek professional advice where needed.
Fusion Media would like to remind you that the data contained in this website is not necessarily real-time nor accurate. The data and prices on the website are not necessarily provided by any market or exchange, but may be provided by market makers, and so prices may not be accurate and may differ from the actual price at any given market, meaning prices are indicative and not appropriate for trading purposes. Fusion Media and any provider of the data contained in this website will not accept liability for any loss or damage as a result of your trading, or your reliance on the information contained within this website.
It is prohibited to use, store, reproduce, display, modify, transmit or distribute the data contained in this website without the explicit prior written permission of Fusion Media and/or the data provider. All intellectual property rights are reserved by the providers and/or the exchange providing the data contained in this website.
Fusion Media may be compensated by the advertisers that appear on the website, based on your interaction with the advertisements or advertisers.
© 2007-2025 - Fusion Media Limited. All Rights Reserved.
