Who is Kevin Hassett? Wolfe looks at the Trump ally tipped to become Fed Chair.
Note from dshort: Financial turmoil in the Eurozone continues to take the spotlight in financial news. But an important sidebar is the sharp decline in Treasury yields. The 10-year note closed the day at another historic low of 1.63, as did the 20-year bond at 2.32. The 30-year, at 2.72, is 19 basis points above it closing low on December 18, 2008.
The Fed's latest strategy for managing the economy, Operation Twist, has less than two months to go. The program was announced on September 21st of last year with the stated purpose of selling $400 billion in shorter-term Treasury securities by the end of June 2012 and using the proceeds to buy longer-term Treasury securities. The Fed assumed this would put downward pressure on longer-term rates, which would stimulate the economy through "a broad easing in financial market conditions." In other words, more loans at lower rates.
How effective has this strategy been? Here is a snapshot of selected yields and the 30-year fixed mortgage since the inception of Operation Twist.
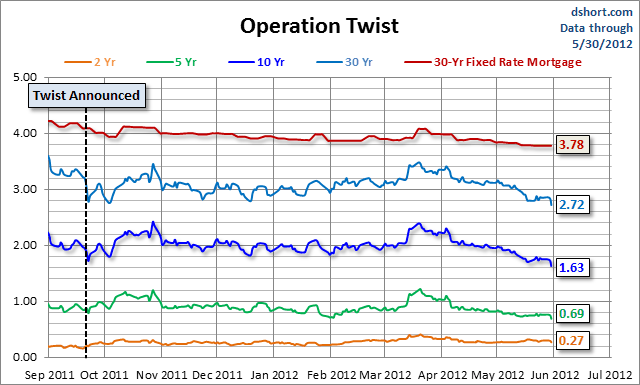
The 10-year note had been hovering around the two percent level for the past few months after hitting its historic low of 1.72 immediately following the September 21st "Twist" announcement last year. Despite the Fed's stated purpose of lowering long-term interest rates, the 10-year steadily rose to an interim high of 2.42 on October 27th, but it soon settled into a pattern of hovering around 2.00 with the one quick dip to 1.82 and an upper range of 2.11. But in mid-March the yield on the 10 surged to a closing high of 2.39 on March 19th and then declined to a hover range around 2.23. Since the mid-March drama, which was certainly counter the Fed's stated intention, the yield on the 10-year has steadily fallen to its historic closing low of 1.63.
The 30-year fixed mortgage, according to the latest Freddie Mac weekly survey, is at its all-time low at 3.78.
As for loans to small businesses, here's a snippet from the latest NFIB Small Business Economic Trends report:
Financing remained low on the list of concerns for business owners. Only 3 percent cited financing as their top business problem. Ninety-two (92) percent reported that all their credit needs were met or that they were not interested in borrowing.
It will be interesting to watch yields during the final month of Operation Twist. Will they drop further? Rise in anticipation of further Fed intervention? Or continue to oscillate in the current range?
Background Perspective on Yields
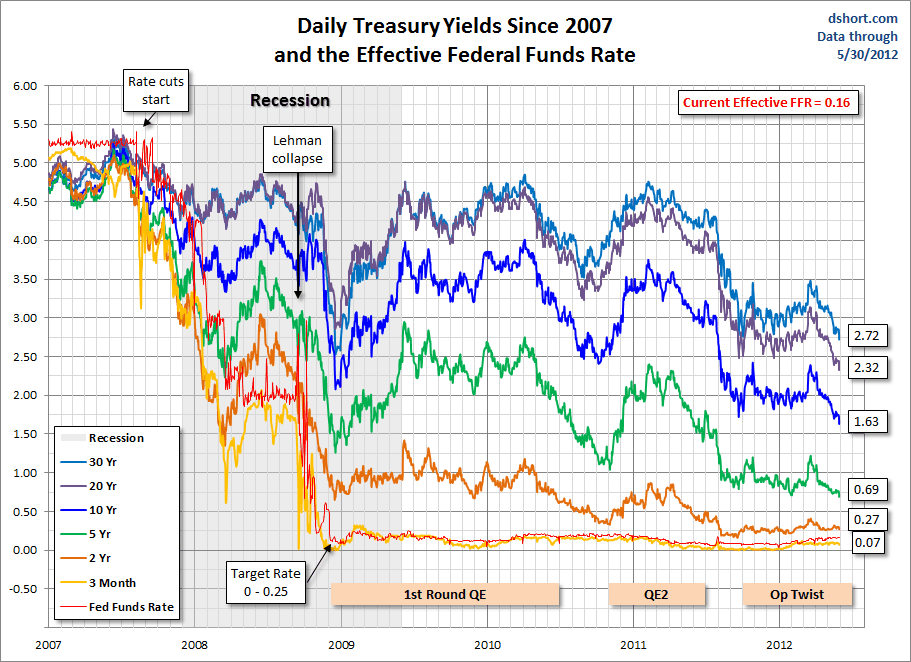
The first chart shows the daily performance of several Treasuries and the Fed Funds Rate (FFR) since 2007. The source for the yields is the Daily Treasury Yield Curve Rates from the US Department of the Treasury and the New York Fed's website for the FFR.
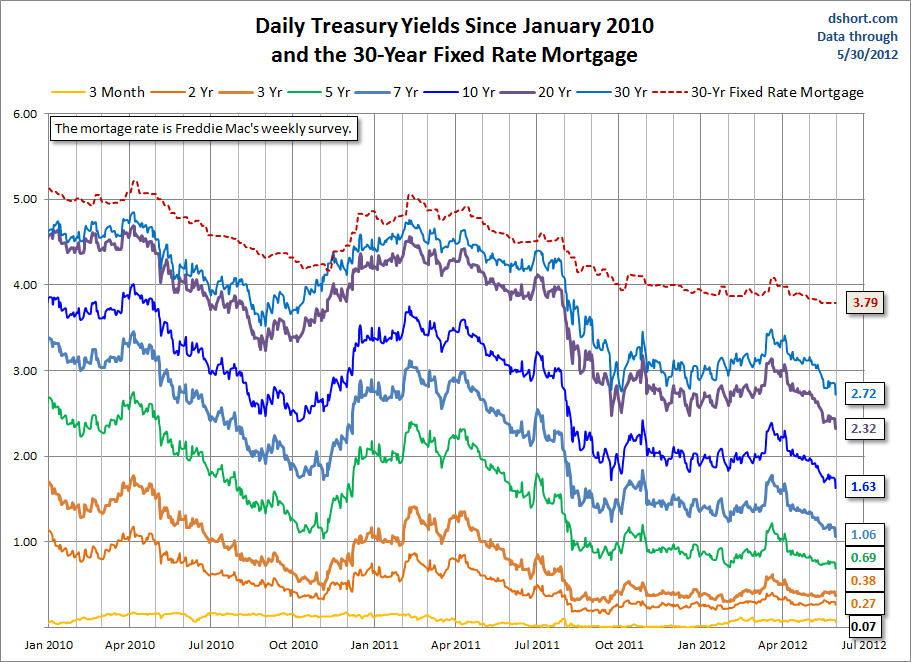
Here's a closer look at the data since 2010 with the 30-year fixed mortgage added to the mix (excluding points).
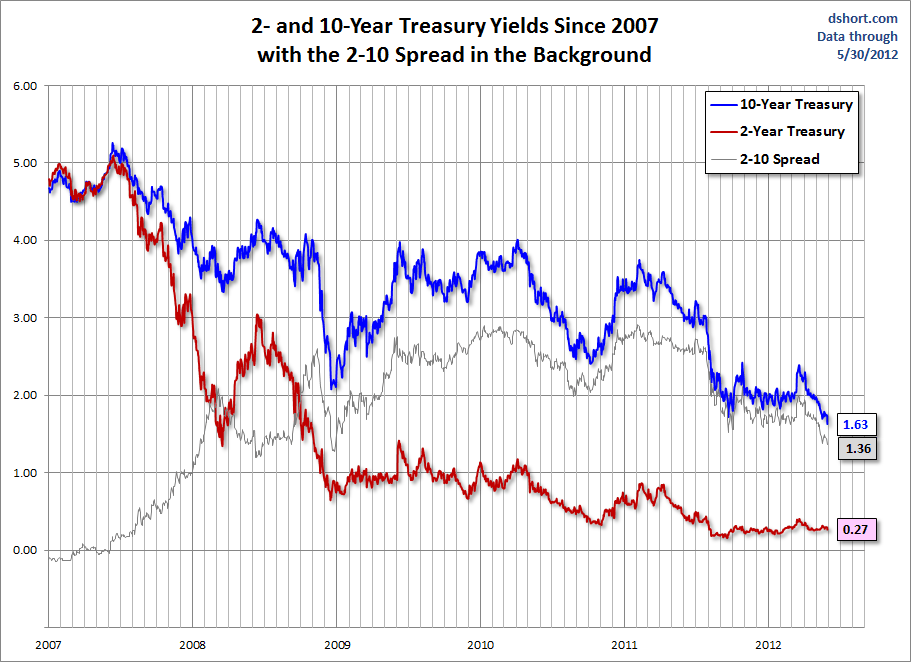
The next chart shows the 2- and 10-year yields with the 2-10 spread highlighted in the background.
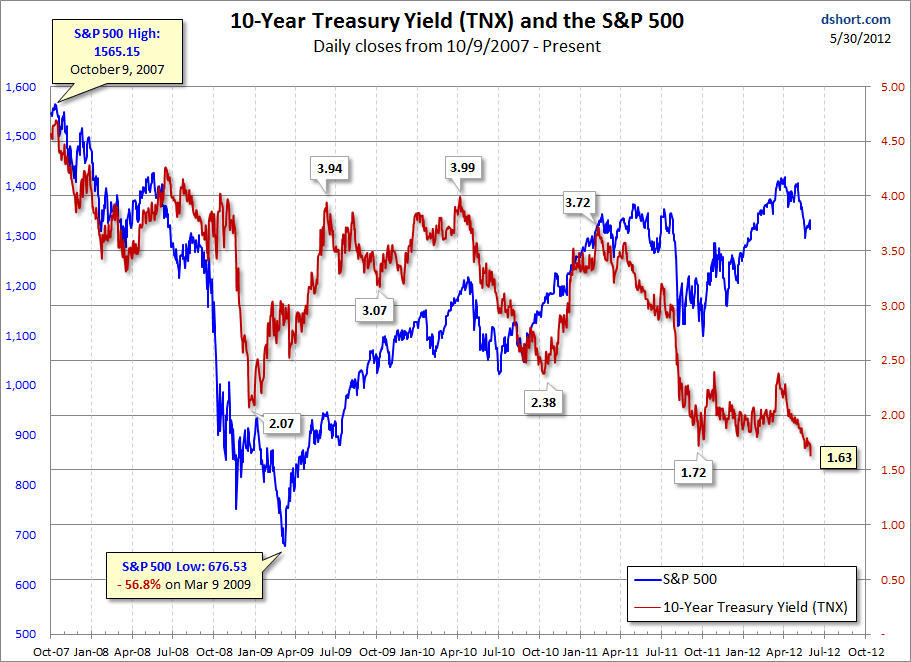
The final chart is an overlay of the CBOE Interest Rate 10-Year Treasury Note (TNX) and the S&P 500.
For a long-term view of weekly Treasury yields, also focusing on the 10-year, see my Treasury Yields in Perspective.
The Fed's latest strategy for managing the economy, Operation Twist, has less than two months to go. The program was announced on September 21st of last year with the stated purpose of selling $400 billion in shorter-term Treasury securities by the end of June 2012 and using the proceeds to buy longer-term Treasury securities. The Fed assumed this would put downward pressure on longer-term rates, which would stimulate the economy through "a broad easing in financial market conditions." In other words, more loans at lower rates.
How effective has this strategy been? Here is a snapshot of selected yields and the 30-year fixed mortgage since the inception of Operation Twist.

The 10-year note had been hovering around the two percent level for the past few months after hitting its historic low of 1.72 immediately following the September 21st "Twist" announcement last year. Despite the Fed's stated purpose of lowering long-term interest rates, the 10-year steadily rose to an interim high of 2.42 on October 27th, but it soon settled into a pattern of hovering around 2.00 with the one quick dip to 1.82 and an upper range of 2.11. But in mid-March the yield on the 10 surged to a closing high of 2.39 on March 19th and then declined to a hover range around 2.23. Since the mid-March drama, which was certainly counter the Fed's stated intention, the yield on the 10-year has steadily fallen to its historic closing low of 1.63.
The 30-year fixed mortgage, according to the latest Freddie Mac weekly survey, is at its all-time low at 3.78.
As for loans to small businesses, here's a snippet from the latest NFIB Small Business Economic Trends report:
Financing remained low on the list of concerns for business owners. Only 3 percent cited financing as their top business problem. Ninety-two (92) percent reported that all their credit needs were met or that they were not interested in borrowing.
It will be interesting to watch yields during the final month of Operation Twist. Will they drop further? Rise in anticipation of further Fed intervention? Or continue to oscillate in the current range?
Background Perspective on Yields
The first chart shows the daily performance of several Treasuries and the Fed Funds Rate (FFR) since 2007. The source for the yields is the Daily Treasury Yield Curve Rates from the US Department of the Treasury and the New York Fed's website for the FFR.

Here's a closer look at the data since 2010 with the 30-year fixed mortgage added to the mix (excluding points).

The next chart shows the 2- and 10-year yields with the 2-10 spread highlighted in the background.

The final chart is an overlay of the CBOE Interest Rate 10-Year Treasury Note (TNX) and the S&P 500.

For a long-term view of weekly Treasury yields, also focusing on the 10-year, see my Treasury Yields in Perspective.
