In this article titled “A Useful Inflation Indicator (and a Decent Bond Market Model)” – dated 12/14/2017 – I wrote about a simple model that, as the name implies, has a decent tracking record as a bond market indicator. For what it is worth, this model has turned “bullish” for bonds.
This signal combined with the potentially bullish signals detailed in this article last week, give me hope that the bond market – currently oversold (and seemingly universally loathed in full “interest rates are certain to go” mode) – may be due for a bounce once this latest selloff runs its course.
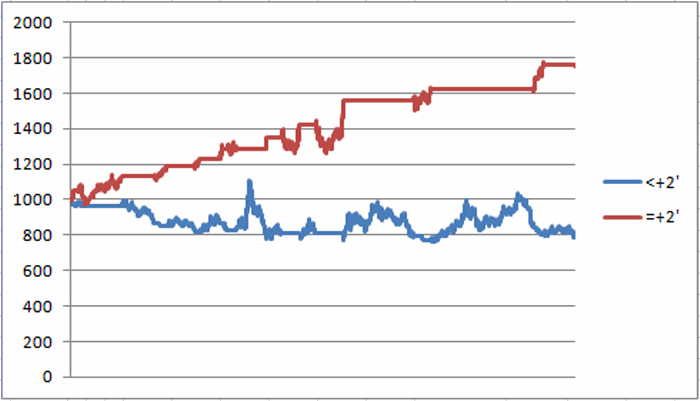
Rather than recreate how the whole thing works please see the original article for details. For the record though, the equity curve for $1,000 invested in the iShares 20+ Year Treasury Bond (NASDAQ:TLT) ETF when the model is bullish (any reading less than +2) versus bearish appears in Figure 1.

Figure 1 – Growth of $1,000 invested in TLT when Test Bond Model
Summary
For the record I am not making any recommendations regarding bonds. I am simply highlighting the fact that several models that I follow have flipped to the bullish side.
This means two things:
1) These systematic “buy” signals – combined with the near universal fear and loathing of the bond market these days – suggests there is a chance that the bond market will bounce sometime in the near future
2) If the bond market does NOT bounce sometime in the near future it may bode very ill for the longer-term trend
