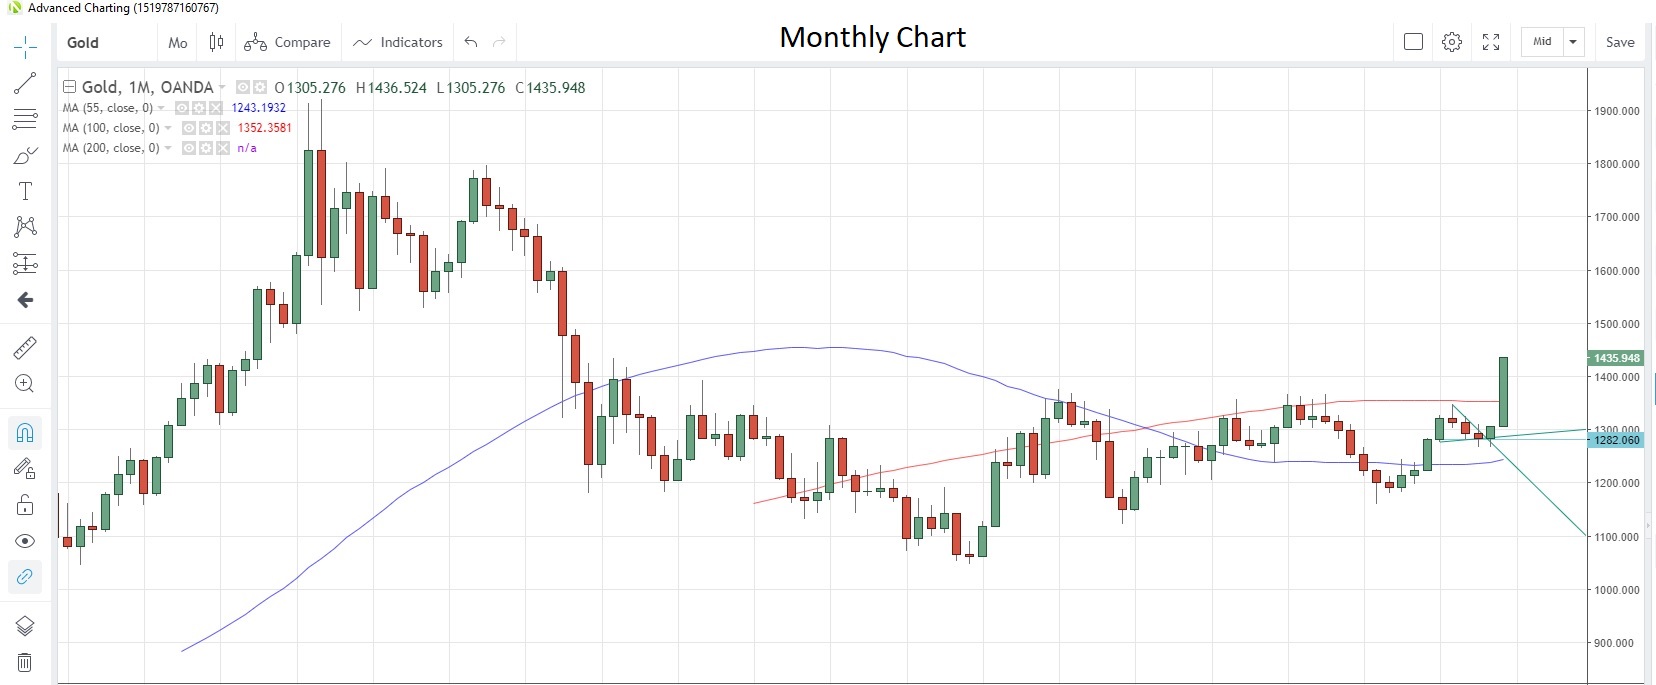
The precarious outlook for global growth and a weaker U.S dollar, on the back of Fed rate cut expectations, helped propel gold to the highest level in nearly six years. The weaker dollar benefited most metals and agricultural commodities, while oil prices firmed on Gulf tensions.
Precious metals
Gold extended recent gains this morning to reach the highest since August 2013 as U.S data released last night implied a potential economic slowdown. The yellow metal looks set to advance for a sixth consecutive week, which would equal the longest stretch since 2016. Bullish bets by speculative investors are now at their highest since January 2018 after seeing an increase for the third consecutive week in the week to June 18, the latest data snapshot from CFTC shows.
Data out of China showed the nation had increased its gold holdings for a sixth straight month in May, with purchases of 14.9 million tons. Exchange-traded funds have also been adding to holdings, adding 1.03 million ounces last Friday, the most in one day since June 2018, which brought total net purchases this year to 2.63 million ounces.
Source, all charts: OANDA fxTrade
Whereas gold has the benefit of its safe haven status, silver is more used for industrial purposes and the clouded outlook for the global economy is weighing on the precious metal. The gold/silver (Mint) ratio was boosted to a record high this morning, according to data compiled by OANDA going back to 2006, as silver lagged behind its safe haven big brother.
The Semiconductor Industry Association reported that the industry’s demand for silver in the first quarter was 13% lower than a year earlier, and slackening demand didn’t let up in April, with a 14.6% y/y decline.
Speculative investors still remain bullish on the commodity despite its relatively lackluster performance, adding to net long positions for a third straight week and boosting them to the highest in 10 weeks.
Platinum remains in consolidation above four-month lows and looks set to advance for a second consecutive week this week. However, from a technical perspective the 55-day moving average is about to cross below the 100-day moving average for the first time since March, which is often interpreted as a longer-term bearish signal. The 200-day moving average at 830.12 acts as the first resistance point. Platinum is now at 815.62
Speculative accounts have been trimming net long positions for the past seven weeks and as at June 18 they are at the lowest since the week of February 19, according to CFTC data.
In contrast, speculative investors seem to favor palladium as they increased net bullish bets for a fifth straight week, boosting them to the highest since the week of March 26, latest CFTC data show. Palladium rose to the highest level since March 27 this morning, and looks poised to post the fourth weekly gain in a row. The metal is testing resistance at the 78.6% Fibonacci retracement of the March-May decline at 1,541 and has so far reached 1,548.
Base metals
Copper posted the biggest weekly gain since March last week and this week could mark the third weekly advance in a row. The rebound from support at the 200-week moving average at 2.6211 has turned speculative investors more bullish on the commodity as they turned net buyers for the first time in nine weeks in the week to June 18, the latest data from CFTC show. The buying pulled net short positioning away from a three-year peak.
On the supply front, Chile’s third-largest mine is facing extended strike action after workers rejected the owner’s wage offer on Saturday. The miner now has another five days to present a new offer with the strike now in its eleventh day. The mine previously endured a 17-day strike in 2013, according to Bloomberg reports. Stockpiles of copper held in warehouses tracked by the London Metal Exchange fell on Friday, pulling back from 10 month highs.
Energy
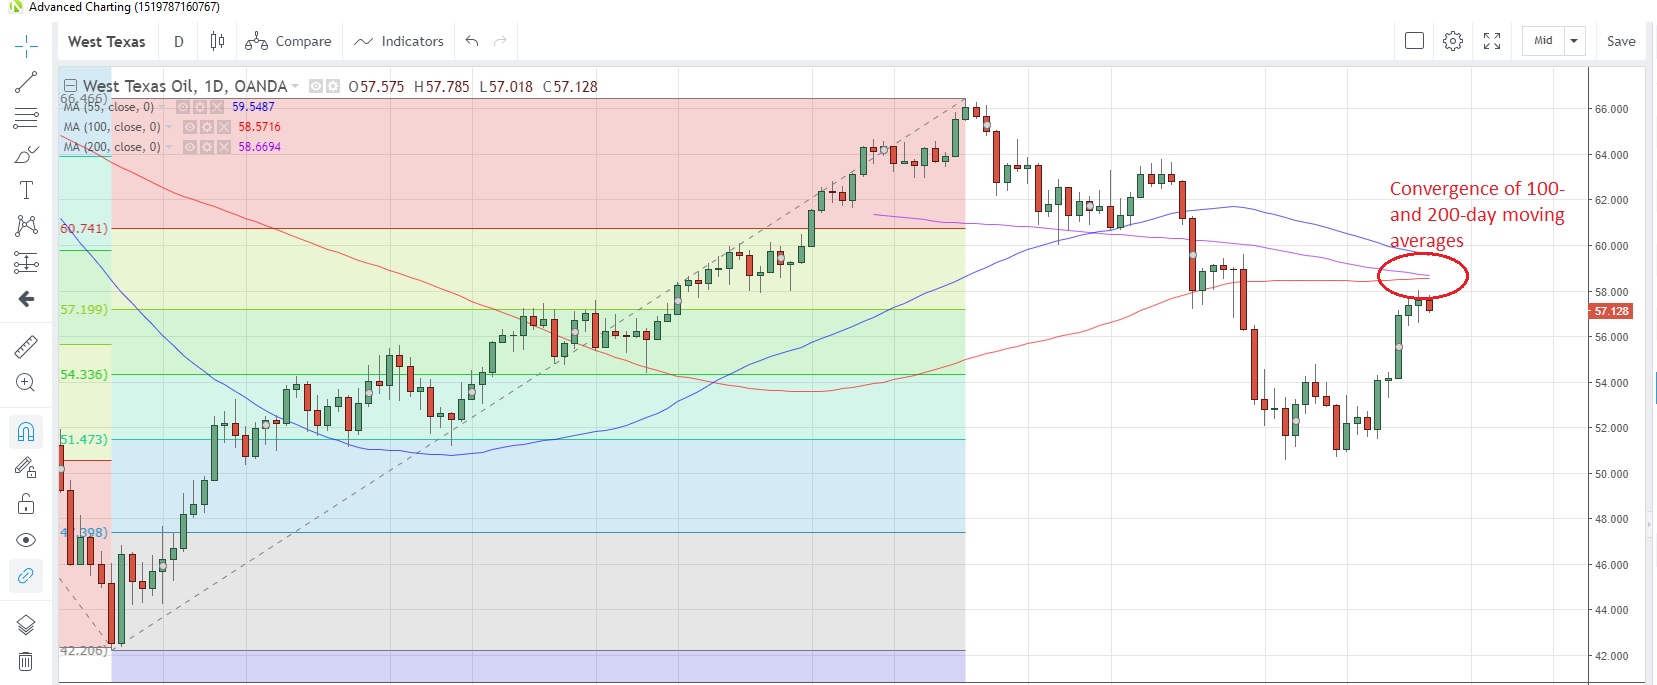
Crude oil prices surged the most in a year last week as an escalation in Gulf tensions and proposed additional U.S sanctions against Iran prompted buying. The surge in prices prompted speculative buying, with investors turning net buyers for the first time in eight weeks to June 18.
According to a recent report from BP, OPEC’s share of the global oil market is shrinking as it cuts production by its members in an attempt to boost prices. OPEC’s share of global production fell to 41.5% last year, the report says, and it is expected to shrink further this year given the organization’s planned cuts and U.S sanctions against Venezuela and Iran.
China’s May crude oil imports rose 3.0% from a year earlier, a slowdown from April’s 10.8% gain, latest data from the Customs Bureau show.
Natural gas prices are still struggling to gain traction in an oversupplied market that has seen demand also on the wane. Prices saw the biggest weekly drop since January last week but are attempting a rebound this week, climbing the most since January 14 yesterday. Forecasts of warmer weather across the central U.S. could have helped the rebound.
However, stockpiles continue to grow, with data to June 21 showing an increase of 115 billion cubic feet (bcf), that’s higher than the five-year average of +84bcf and the 12th consecutive weekly increase in stockpiles. Speculative investors are still bearish on Gas, increasing net short positions to the highest since January 2018 in the week to June 18.
Agriculturals
Commodity markets are waiting for the next U.S Department of Agriculture report on grain stocks, which is due to be published on June 28. Forecasts suggest that wheat plantings could be reduced, while soybean and corn stocks are expected to increase.
Wheat prices have risen every day so far this week but have failed to reach the 10-month highs of last week. Speculative accounts remained net buyers of wheat for the seventh consecutive week to June 18, and net long positions are now at the highest since October 2018.
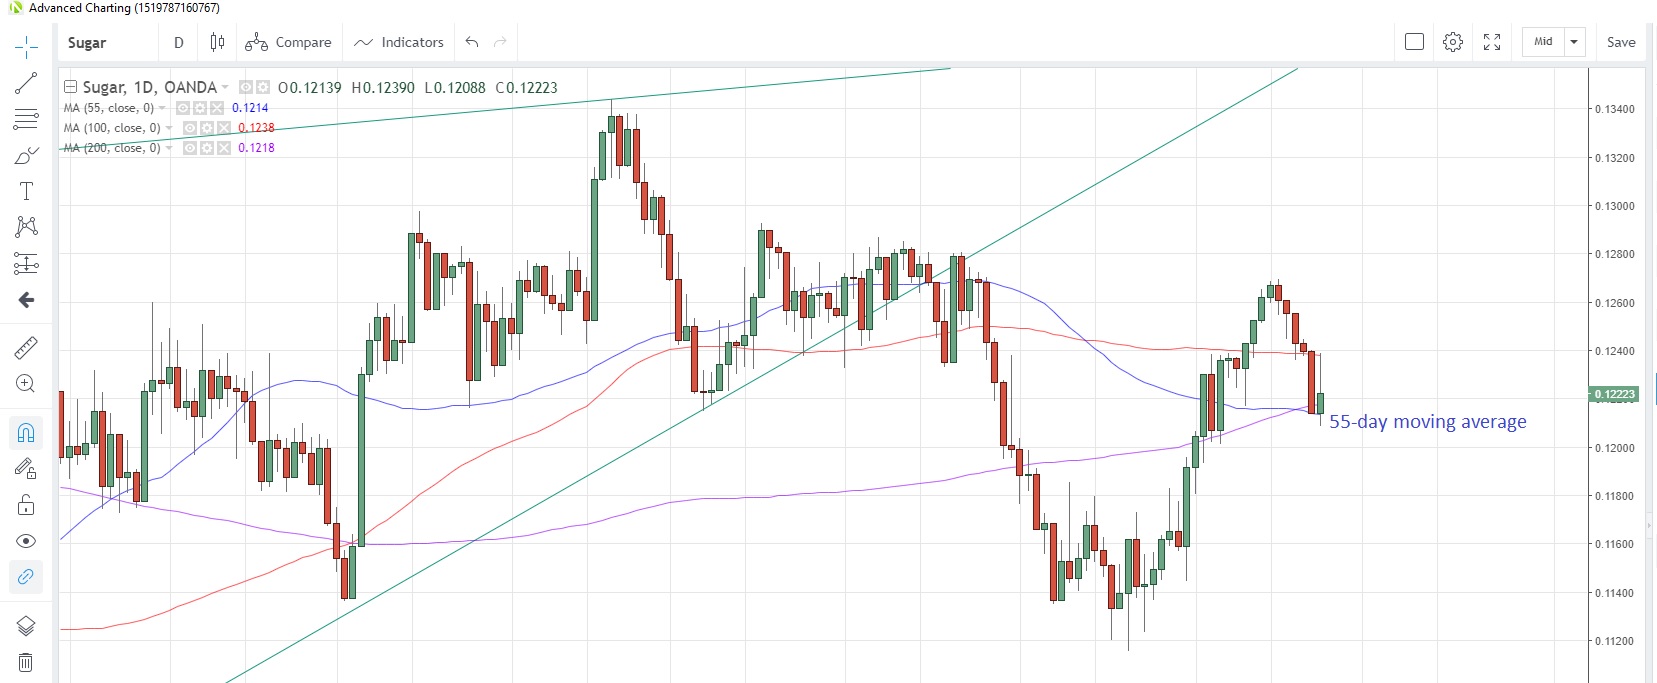
China’s sugar imports rose to 380,000 tons in May, the highest in more than a year, after China issued additional import permits for 1.35 million tons towards the end of May. The news helped stem a five-day decline in prices yesterday as the commodity tested the 55-day moving average support at 0.1214.
Speculative investors trimmed their net short positions to the least in seven weeks, according to data from CFTC to June 18.
Argentina’s corn production is expected to increase 1.8% in June, according to an update by the Agriculture Secretariat on its website reported by Bloomberg. Prices are consolidating near five-year highs and holding below the 100-month moving average at 4.6616.
Soybeans are hovering near four-month highs as wet weather in the U.S is dragging on and preventing crops seeding, hence raising supply concerns and boosting prices. Net short positions held by speculative investors are at the lowest since the week of February 5, when they were marginally positive. Investors flipped to being net short the following week.


