
The EURUSD has fallen below the 50% of the days range and the 100 hour MA at the 1.2727. The level was also the 200 bar MA on the 5 minute chart which increases the importance of the level. I would expect traders to use the level as resistance now. 1.2708 is 61.8% of the days range and below that the 1.2687 will be the next target. This was the high from the non trending day yesterday.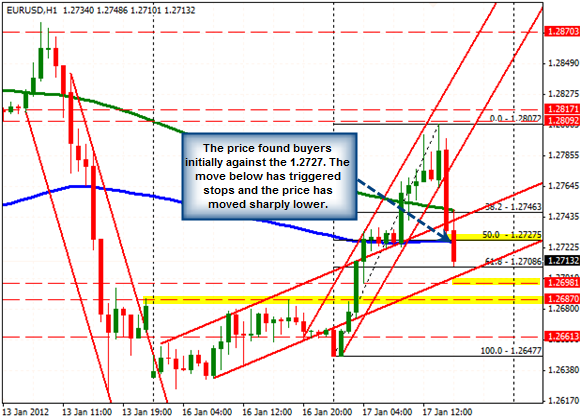 EUR/USD H1" title="EUR/USD H1" width="580" height="420">
The GBPUSD moves toward the lower boundary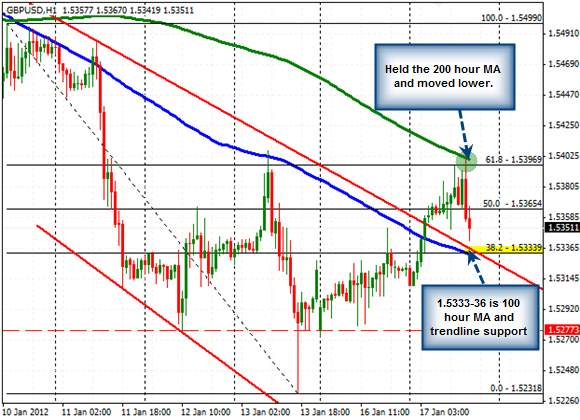 GBP/USD H1" title="GBP/USD H1" width="580" height="420">
The GBPUSD tested the 200 hour MA (green line in the chart above) and found willing sellers against the level. The price is now back down and looking toward what is good support on the same chart at the 38.2% retracement and the underside of the trendline broken earlier today. Also, supporting the area is the 50% of the move up from the weeks low. That level comes in at the 1.5337 level. So with the hourly showing support at 1.5333 and 1.5336 and the retracement at the 1.5337, look for the price to respect the level and use it to define risk.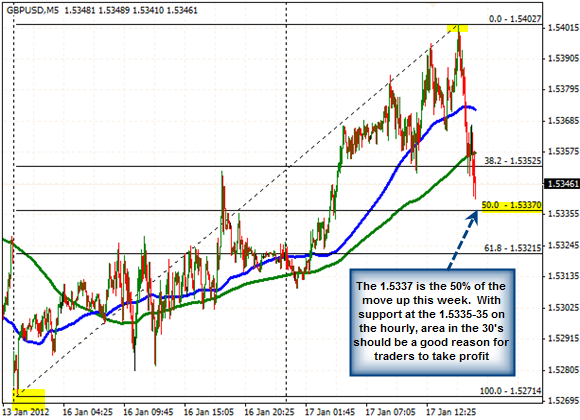 GBP/USD M5" title="GBP/USD M5" width="580" height="420">
EURJPY falls from upside trendline resistance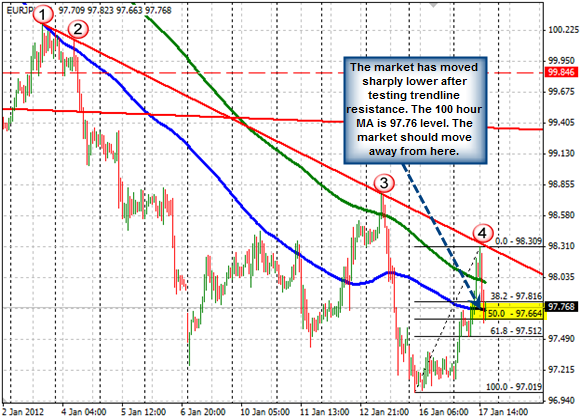 EUR/JPY" title="EUR/JPY" width="580" height="420">
The EURJPY extended to the topside trendline (see point 4 in chart above) and has pushed back toward the flatenning 100 hour MA. The price decline has stalled at the level as traders figure out the next move. I get the feeling the market may look to consolidate for a while at the 100 hour level and midpoint of the move.
GBPUSD playing the range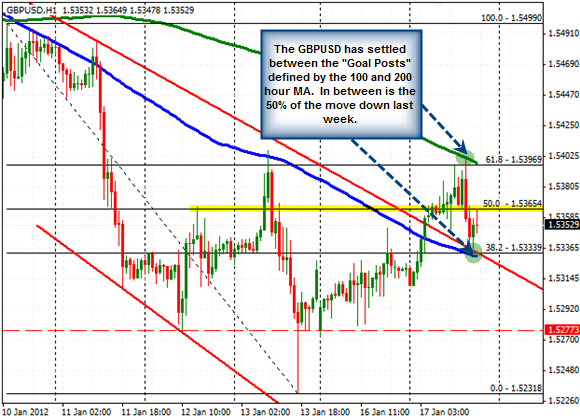 GBP/USD H1" title="GBP/USD H1" width="580" height="420">
The GBPUSD found the support at the 100 hour MA and 38.2% retracement as outlined in the previous point. Earlier the 200 hour MA and 61.8% retracement level held resistance. In between is the 50% retracement level gets in the way at the 1.5365. The price off the low, peaked at this level and is now looking a little more weak than strong.
On the daily chart, the price has been largely contained in a narrow range over the last 5 or so days. This came after a pretty decent move lower last week (it was better than the EURUSD range at least). The consolidation has allowed technical tools like the 100 and 200 hour MA to catch up to the price.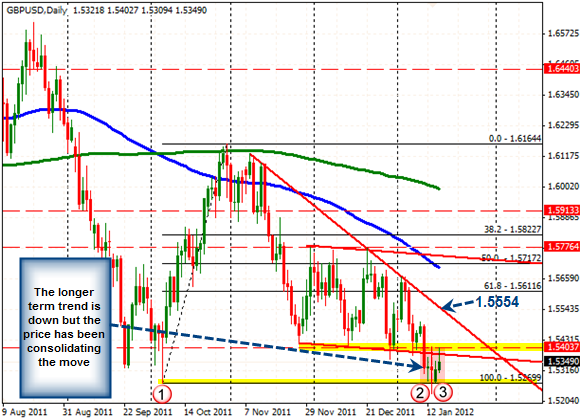 GBP/USD" title="GBP/USD" width="580" height="420">
Now the market has a decision to make….Does it want to go higher or lower? The weekly chart below may provide some additional clues. Last week, while the price was moving lower, the price fell below trendline connecting lows from December 2010 and the low from October . That move failed to close below the line. As a result, there may be more traders who might get tired with the downside and look to cover/buy a dip. Use the 100 hour MA as a support stop below. Look for the breach of the 200 hour above to help confirm a more favorable bias and further upward momentum.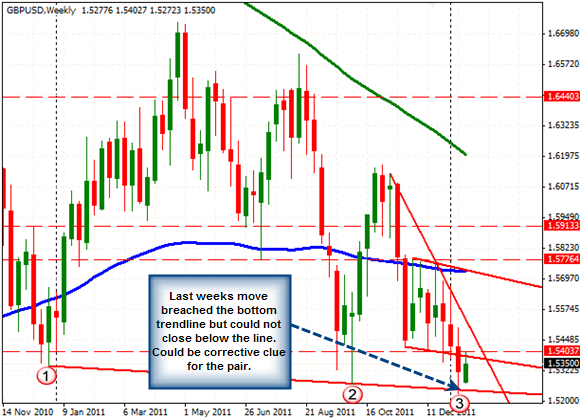 GBP/USD" title="GBP/USD" width="580" height="420">
- English (UK)
- English (India)
- English (Canada)
- English (Australia)
- English (South Africa)
- English (Philippines)
- English (Nigeria)
- Deutsch
- Español (España)
- Español (México)
- Français
- Italiano
- Nederlands
- Português (Portugal)
- Polski
- Português (Brasil)
- Русский
- Türkçe
- العربية
- Ελληνικά
- Svenska
- Suomi
- עברית
- 日本語
- 한국어
- 简体中文
- 繁體中文
- Bahasa Indonesia
- Bahasa Melayu
- ไทย
- Tiếng Việt
- हिंदी
EUR/USD Continues to Take it on the Chin
Published 01/18/2012, 04:07 AM
Updated 02/13/2020, 10:25 AM
EUR/USD Continues to Take it on the Chin
Latest comments
Loading next article…
Install Our App
Risk Disclosure: Trading in financial instruments and/or cryptocurrencies involves high risks including the risk of losing some, or all, of your investment amount, and may not be suitable for all investors. Prices of cryptocurrencies are extremely volatile and may be affected by external factors such as financial, regulatory or political events. Trading on margin increases the financial risks.
Before deciding to trade in financial instrument or cryptocurrencies you should be fully informed of the risks and costs associated with trading the financial markets, carefully consider your investment objectives, level of experience, and risk appetite, and seek professional advice where needed.
Fusion Media would like to remind you that the data contained in this website is not necessarily real-time nor accurate. The data and prices on the website are not necessarily provided by any market or exchange, but may be provided by market makers, and so prices may not be accurate and may differ from the actual price at any given market, meaning prices are indicative and not appropriate for trading purposes. Fusion Media and any provider of the data contained in this website will not accept liability for any loss or damage as a result of your trading, or your reliance on the information contained within this website.
It is prohibited to use, store, reproduce, display, modify, transmit or distribute the data contained in this website without the explicit prior written permission of Fusion Media and/or the data provider. All intellectual property rights are reserved by the providers and/or the exchange providing the data contained in this website.
Fusion Media may be compensated by the advertisers that appear on the website, based on your interaction with the advertisements or advertisers.
© 2007-2025 - Fusion Media Limited. All Rights Reserved.