But before embellishing Gold's having returned to that milestone, we begin this Saturday morning with Breaking News. Do you know what happened to Gold yesterday (Friday)? The FinMedia apparently did not take notice...
"I did mmb!"
I know that you did, Squire. (The boy's all puffed up from manning the controls a week ago from here in The City toward producing The Gold Update whilst we were surviving the desert wild). Anyway, here 'tis:
Gold for the first time since 11 February 2013 traded above its 300-day moving average (1387), briefly reaching 1388 intra-session. A cherished reunion, which henceforth and indeed rightly ought be nurtured more often than not, well into the future. 'Twas an emotional moment for us here in admittedly wiping away a joyful tear...
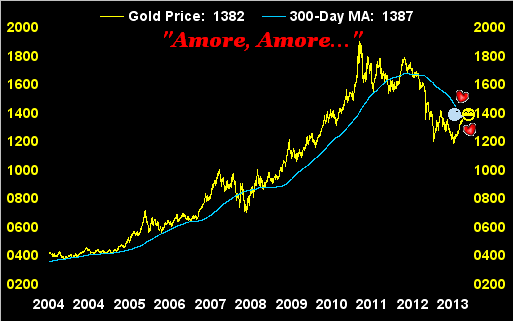
...as a Welcome Home buss from the traditionally stalwart supportive blue line was placed upon Gold's cheek at 06:24 Pacific Time, whereupon for a few glorious seconds, price resided above average. A beautiful thing to behold, which many-a-nattering nabob of negativism proclaimed would never recur.
11 Months ago to this date, which was StateSide Tax Day, Gold traded down to 1377 for the first time since having achieved it back on 14 October 2010. And as Base Camp 1377 was thus formed last April, everybody hated Gold. Why, had you bought or held Gold at 1377 you were, in what I believe is the contemporary parlance, stoopid. Yesterday (Friday), Gold returned up to Base Camp 1377 -- but this time at that very same level -- everybody loves it -- and moreover, had you actually bought or held Gold at 1377, you're now considered brilliant.
'Course, if as herein encouraged you've been prudently adding on occasion to your Golden Pile along price's journey through the 1300s, 1200s and even 1100s, today you're quite brilliantly indeed ahead of the pack. Still, let's be honest: the change in Gold year-over-year for most folks has been anything but an illusion, many-a-precious metals portfolio getting crushed with not just the weakest of Longs bailing out, only now to be wondering why. Whereas price being the truth, here again at 1377 is an even better scenario than 'twas last April, for lo these 11 months the StateSide money supply (M2) alone has increased by $589 billion, a lurch of 10% in a purportedly benign inflationary environment. By only that measure, exclusive of our dire debt, plus that of other nations along with their own debasing schemes, Gold's returning to Base Camp 1377 + 10% = 1515. Hint: if you've bailed, there's happily time to board.
All that being said, four weeks have now passed since our expectations for a natural pullback of Gold's price into the upper 1200s. Not that it can't still happen, but 'twould be quite curious to see where price would be today were the Crisis of the Crimea not to have occurred, nor the the sadly fascinating disappearance of the Malay airliner, nor the sudden shock of two buildings blowing up in New York City, nor the once rampaging dragon of the Chinese economy now running in reverse, tail between its legs, (and that's a long tail). The point being: when analytically expectant of some natural pullback in price, all of this global chaos then intercedes and the technicals get tossed à la toilette. "Tirez la chasse, s.v.p."
The question is, of course, when these recent events that have garnered a "safe haven" bid for Gold become rationalized such that the childlike innocence of complacency returns to the markets across the BEGOS spectrum (Bond/Euro and Swiss/Gold, Silver and Copper/Oil/S&P), shall Gold then finally pullback? The answer inevitably is "yes", but perhaps not to the extent (1290-1275) that we'd been considering some four weeks ago. Those events cited above, and many others like them lurking in the tea leaves, have amply returned the Gold dynamic from medium-term bearish to broad-term bullish...
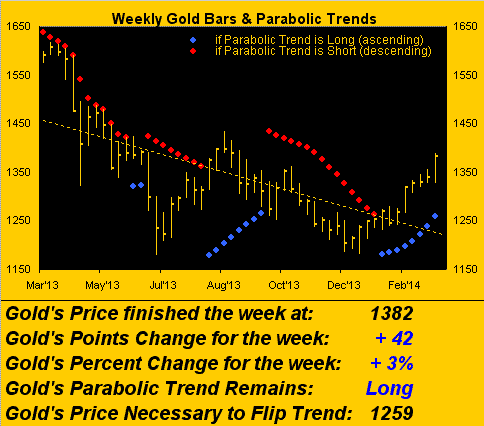
Indeed, thy eyes do not thee deceive. Gold's current price of 1382 rests 123 points above the parabolic trend level of 1259. That's plenty of correctable wiggle room with which to work without flipping the weekly trend from Long back to Short any time soon. Moreover, next week's blue dot shall mark the ninth in the current Long series, an achievement not seen since Autumn 2012. And for those of you who are scoring at home, Gold's having now recorded 11 up weeks in the last 12 hasn't occurred since 2007.
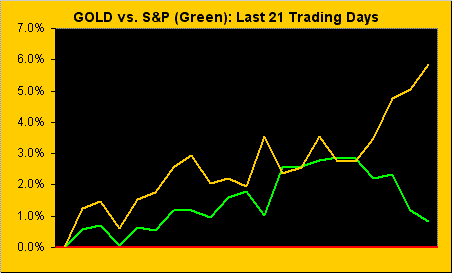
Further, recall this bit from our first missive of 2014, (Gold being 1237 at that writing): "...Lofty a goal as it may seem, at least returning into The Floor (1579-1466) by mid-year would be a remarkable achievement for 'twould truly mean the sentiment for Gold has whirled 'round..." Today at 1382, we're just 84 points away from the base of The Floor (1466) and 'tis only mid-March! Oh the temptation to proclaim that Gold's low for the entirety of 2014 is now in place, as might be the high for the S&P:
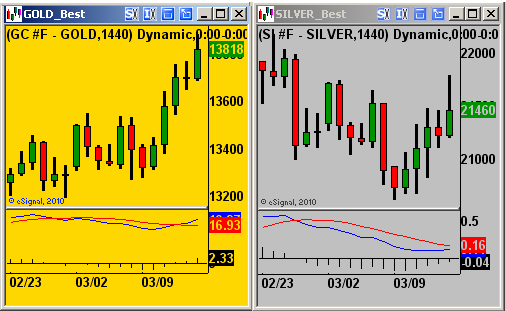
As for the stance of the MACD (moving average convergence divergence) studies on the daily bars for Gold and Silver, as was anticipated two weeks ago would occur, both crossed negatively. But only Gold has since turned positive, Sister Silver's wearing her industrial metal jacket and thus succumbing somewhat to the slide of the S&P, as led by Copper and Oil, and of course, China:
Thoughtfully through the midst of this euphoric run in Gold, again which the FinMedia naturally seem if not choose to ignore, (for 'tis only good press to expound upon the yellow metal when in decline), we are most mindful of maintaining one's feet upon the ground. Gold year-to-date is already +14.7%: at that clip, 'twould close at an all-time high of 1925 on 25 August. Whilst arguably the case can be made that price ought already be there, many an overhead battle need yet be fought. To wit, here's the chart of Gold's pricing structure, (weekly bars), with the usual annotations:
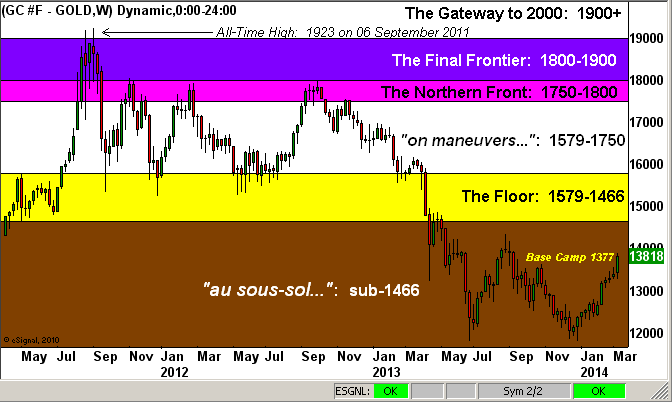
In fact as we look ahead through 2014, should the year's low (1203) truly be in place and the trend on balance remain indicative of higher levels, look in the above structure chart left-of-center within the yellow swath that defines The Floor: those three very distinct prior lows in the 1500s shall almost certainly be resistive, the average level therein being 1529. Should that be as far as Gold reaches this year, and it moreover close out 2014 at that average level, 'twill be recorded as a remarkable +27% annual gain, the third best since the turn of the millennium, (rivaled only by 2007's +31% and 2010's +30%). Not bad.
Nearer-term, let's turn to the Baby Blues, the dots which depict the consistency of markets' 21-day linear regression trends. On the left we've the market that's been left for dead (Gold); at center Sister Silver, clearly as noted not adorned in her precious metal pinstripes; and on the right the poor old S&P for which we certainly remain on "crash-watch". Yikes... that is ugly:
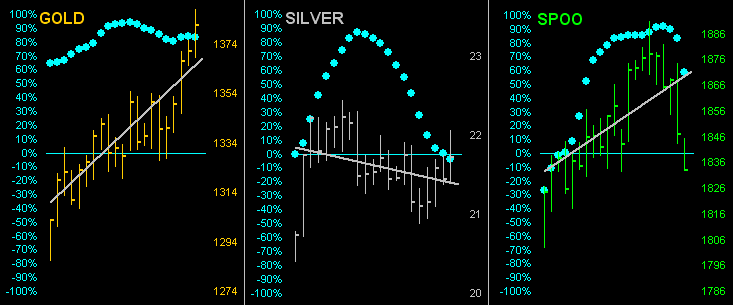
And yet with respect to the latter, dare I say demoniacally, the blind continue leading the blind. I'm tellin' ya folks, you cannot make this stuff up. Again, withholding the name, I read of an analyst this past week who stated "...for most American companies, growth in earnings has kept pace with the increase in stock prices..." If that is true, will somebody please explain to me why Bob Shiller's more ponderous, cyclically-adjusted price/earnings ratio for the S&P has year-over-year risen from 21x to 25x, why my "live" p/e at this writing is 32.1x, and why for the Q4 Earnings Season having recently ended, of the 2,000+ companies for which we gathered results, 43% did not improve their year-over-year bottom line? I shan't even mention that the yield on the 10-year Treasury Note is now 77% higher than that on the S&P. (Shussshh... don't tell anybody; let 'em chase price whilst we hang onto our Gold).
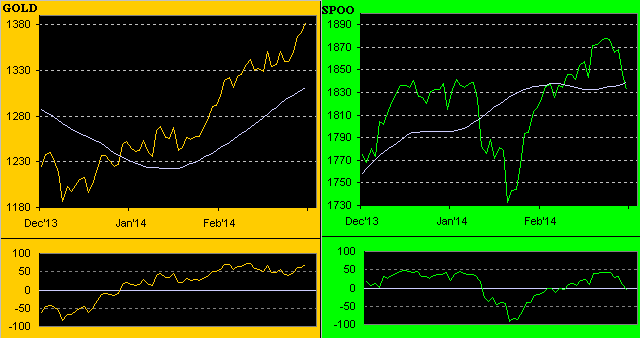
Meanwhile, from the BEGOS valuation perspective, the oscillators at the foot of these next two charts clearly indicate Gold as pushing the upper limits as regressed to the price movement (smooth pearly line) of the other primary BEGOS Markets, but the S&P as only neutrally-valued and thus subject to far further downside, (just as the Baby Blues shown above are suggesting):
Toward closing, let's pair these two markets once again, this time with their respective 10-day trading profiles, the coloured swaths being Friday's trading ranges and white bars their settling prices:
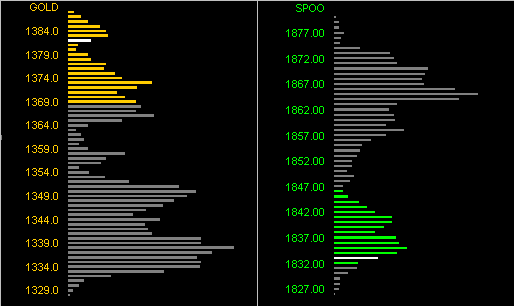
Lots of lovely support there for Gold; but as for the S&P: don't be in that market.
Finally, as if there wasn't already enough economic and geo-political influence to cry over out there, lest we forget, Old Yeller and the Boys will be mixing it up mid-week in Episode III of The Taper Caper, (to be followed by a fourth trimming at April's end -- but from our perspective should the Economic Barometer over at the website continue to descend, not necessarily a fifth reduction at the mid-June meeting). Indeed, 'tis marvelously coincident that next week we've the launch on the London Stock Exchange of BooHoo! The whole world may have gone barmy but Gold's still a bargain!