A couple of months ago (September 2011) Grantham, Mayo, Van Otterloo & Co. LLC (GMO) published a white paper on their website entitled, “Between Errors of Optimism and Pessimism – Observations on the Real Estate Cycle in the United States and China” authored by Edward Chancellor, in which both the U.S. and Chinese real estate markets were analyzed in conjunction with the historical factors that tend to somewhat accurately aid investors in analyzing the real estate market cycles in order to gain an idea as to whether the market has reached a peak or a trough. The paper was extremely well written and informative focusing on fact while avoiding biased subjective conjecture. The paper summarized the market conditions that often mark a peak in prices as well as those that are often observed at a trough. This article will look to summarize some of the more applicable points as they relate to the U.S. market in combination with additional analysis in an effort to aid readers in determining whether or not the U.S. market is poised for a recovery any time soon.
Timing any market perfectly on a consistent basis is impossible. An investors best hope is to thoroughly analyze historical data and trends to look for a probable or most likely future trend. In relation to real estate, finding a peak or trough can be extraordinarily challenging as factors such as confidence, the availability of credit, macroeconomics, the supply of houses, government intervention, monetary and fiscal policy, (to name a few) all have an unquantifiable weighted factor of influence on the short and longer term direction of the housing market. Furthermore, as with the equity markets, it is not uncommon to have “waves” or small up trends in the market during an overall period of decline (or vice versa). This can be observed on a minute scale (month to month) or even using years and in some cases decades. In their now famous book “This Time Is Different”, economists Rogoff and Reinhart reference 6 years as being approximately the average time it takes for a housing market to fall from its peak and hit is trough. Chancellor references this in his paper as well as the example of Japan’s decade long period of housing price declines which demonstrates how lengthy and unpredictable a decline can be.
The recent collapse of U.S. housing prices started about 4 years ago. If one were to use history as a guide, it could be argued that the recovery is still about 2 years off. Given the fact that the run up in prices was historic and Chancellor cites evidence to show that the bigger they (bubbles) are the harder they fall, 2 years could prove to be generous. Chancellor discuses human psychology, the availability of credit, and the government when looking at how bubbles are formed and popped. When at the bottom of a cycle he states, using some of Homer Hoyt’s ideas, that investors often see the following: low valuations, lower leverage and loan to value ratios with deposits trending higher, a decline in foreclosures so that supply moves more in sync with the reality of current demand, credit availability, the end of deflation, low housing turnover (trapped underwater homeowners who can’t or won’t sell help mark the trough), rising rents, and pessimism toward real estate (more of a contrarian view).
Furthermore, Chancellor cautiously notes that, “real estate markets spend longer going down or moving sideways than they do going up.” He attributes this trend to the illiquid nature of real estate. For those looking to buy now, it should go without saying that the prospect of “flipping” or making a short term “investment” is not a good one. In addition, there is no rush in trying to lever up due to the fear that low interest rates are not hear to stay for the foreseeable future as the Fed announced months ago that they would keep rates low through mid 2013.
In analyzing some of the characteristics that often accompany a trough it could be argued that we are approaching the bottom (given the tightening seen by lenders in demanding higher down payments for example), but haven’t got there quite yet. Most notably, government interference in slowing the foreclosure process has kept the percentage of loans in foreclosure at 4.43% for Q3 2011 which is unchanged from Q2 2011 and .04% higher than one year ago according to the Mortgage Bankers Association. This historical average has been approximately 1% from 1979 to 2007 (see Exhibit 8 on page 14 of Chancellor’s paper).
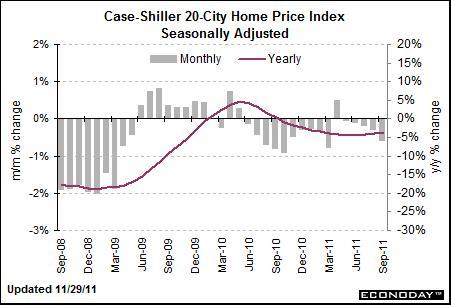
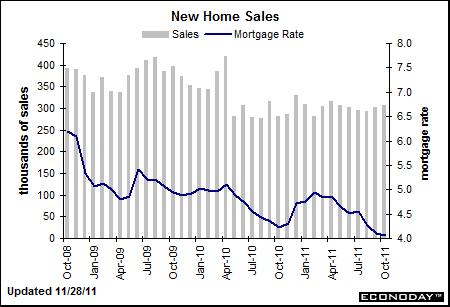
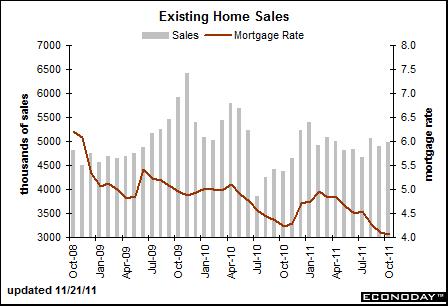
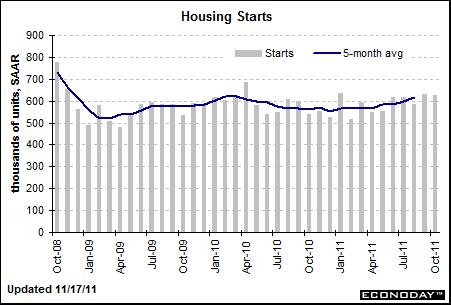
Current market health and trends are often analyzed via the Case-Shiller Home Price Index (CSHPI), new home sales, existing home sales, and housing starts, to name a few. The four charts taken from Bloomberg can be viewed below.

Regarding the Case-Shiller Home Price Index Bloomberg reported November 29th, “Evidence is building fast that home prices are falling into deepening contraction, the likely result of distressed sales tied to foreclosures. Case-Shiller data for September show a very heavy 0.6 percent monthly decline for the both adjusted and unadjusted 20-city indexes.”

In addition to the worrisome trend shown in the CSHPI new home sales have remained at consistently depressed levels since April of 2010 despite a dramatic drop in mortgage rates.

While existing home sales have looked more promising in showing signs of a recovery as falling prices are drawing down the supply of existing homes (sales rose 1.4 percent in October to a 4.97 million annual rate), the aforementioned foreclosure backlog threatens their continued improvement in the months and years to come.

Finally, when looking at housing starts Bloomberg reported that, “For the latest month, multifamily permits gained 24.4 percent while single-family permits rose 5.1 percent. On a year-ago basis, multifamily permits are up 48.0 percent while single-family permits are up 6.6 percent.” The trend in multi-family housing is not indicative of a healthy economy or recovery as people clearly can’t afford to be individual homeowners and choose to live with friends, family, and strangers instead.
In summary, there are some positive signs pointing toward a bottom as some of Chancellor’s criteria have been met. However, the decline is still not at the average of six years, the government has temporarily interfered with the foreclosure process (the supply), and Europe is entering a recession while coming ever closer to a catastrophic collapse.
Any market, whether it is currency, baseball cards, or real estate sees the value of its traded commodity (in this case houses) fall with a substantial increase in supply. The influence of supply alone often trumps the other factors that contribute to that commodities future price direction. For this reason along with the risk associated with contagion and a global recession stemming from Europe investing in housing is just too risky unless there is a commitment and ability to hold for the long term (at least 7-10 years). Chancellor puts the real estate cycle into five easy steps in his conclusion: (1) improvement , (2) growing confidence and prosperity, (3) excitement and overtrading, (4) convulsion, pressure, stagnation, and distress, and (5) quiescence. He believes that we are around the 4-5 range in relation to these steps. I would agree with him and add that stages 4-5 will likely last for at least a few more years to come.
Timing any market perfectly on a consistent basis is impossible. An investors best hope is to thoroughly analyze historical data and trends to look for a probable or most likely future trend. In relation to real estate, finding a peak or trough can be extraordinarily challenging as factors such as confidence, the availability of credit, macroeconomics, the supply of houses, government intervention, monetary and fiscal policy, (to name a few) all have an unquantifiable weighted factor of influence on the short and longer term direction of the housing market. Furthermore, as with the equity markets, it is not uncommon to have “waves” or small up trends in the market during an overall period of decline (or vice versa). This can be observed on a minute scale (month to month) or even using years and in some cases decades. In their now famous book “This Time Is Different”, economists Rogoff and Reinhart reference 6 years as being approximately the average time it takes for a housing market to fall from its peak and hit is trough. Chancellor references this in his paper as well as the example of Japan’s decade long period of housing price declines which demonstrates how lengthy and unpredictable a decline can be.
The recent collapse of U.S. housing prices started about 4 years ago. If one were to use history as a guide, it could be argued that the recovery is still about 2 years off. Given the fact that the run up in prices was historic and Chancellor cites evidence to show that the bigger they (bubbles) are the harder they fall, 2 years could prove to be generous. Chancellor discuses human psychology, the availability of credit, and the government when looking at how bubbles are formed and popped. When at the bottom of a cycle he states, using some of Homer Hoyt’s ideas, that investors often see the following: low valuations, lower leverage and loan to value ratios with deposits trending higher, a decline in foreclosures so that supply moves more in sync with the reality of current demand, credit availability, the end of deflation, low housing turnover (trapped underwater homeowners who can’t or won’t sell help mark the trough), rising rents, and pessimism toward real estate (more of a contrarian view).
Furthermore, Chancellor cautiously notes that, “real estate markets spend longer going down or moving sideways than they do going up.” He attributes this trend to the illiquid nature of real estate. For those looking to buy now, it should go without saying that the prospect of “flipping” or making a short term “investment” is not a good one. In addition, there is no rush in trying to lever up due to the fear that low interest rates are not hear to stay for the foreseeable future as the Fed announced months ago that they would keep rates low through mid 2013.
In analyzing some of the characteristics that often accompany a trough it could be argued that we are approaching the bottom (given the tightening seen by lenders in demanding higher down payments for example), but haven’t got there quite yet. Most notably, government interference in slowing the foreclosure process has kept the percentage of loans in foreclosure at 4.43% for Q3 2011 which is unchanged from Q2 2011 and .04% higher than one year ago according to the Mortgage Bankers Association. This historical average has been approximately 1% from 1979 to 2007 (see Exhibit 8 on page 14 of Chancellor’s paper).
Current market health and trends are often analyzed via the Case-Shiller Home Price Index (CSHPI), new home sales, existing home sales, and housing starts, to name a few. The four charts taken from Bloomberg can be viewed below.

Regarding the Case-Shiller Home Price Index Bloomberg reported November 29th, “Evidence is building fast that home prices are falling into deepening contraction, the likely result of distressed sales tied to foreclosures. Case-Shiller data for September show a very heavy 0.6 percent monthly decline for the both adjusted and unadjusted 20-city indexes.”

In addition to the worrisome trend shown in the CSHPI new home sales have remained at consistently depressed levels since April of 2010 despite a dramatic drop in mortgage rates.

While existing home sales have looked more promising in showing signs of a recovery as falling prices are drawing down the supply of existing homes (sales rose 1.4 percent in October to a 4.97 million annual rate), the aforementioned foreclosure backlog threatens their continued improvement in the months and years to come.

Finally, when looking at housing starts Bloomberg reported that, “For the latest month, multifamily permits gained 24.4 percent while single-family permits rose 5.1 percent. On a year-ago basis, multifamily permits are up 48.0 percent while single-family permits are up 6.6 percent.” The trend in multi-family housing is not indicative of a healthy economy or recovery as people clearly can’t afford to be individual homeowners and choose to live with friends, family, and strangers instead.
In summary, there are some positive signs pointing toward a bottom as some of Chancellor’s criteria have been met. However, the decline is still not at the average of six years, the government has temporarily interfered with the foreclosure process (the supply), and Europe is entering a recession while coming ever closer to a catastrophic collapse.
Any market, whether it is currency, baseball cards, or real estate sees the value of its traded commodity (in this case houses) fall with a substantial increase in supply. The influence of supply alone often trumps the other factors that contribute to that commodities future price direction. For this reason along with the risk associated with contagion and a global recession stemming from Europe investing in housing is just too risky unless there is a commitment and ability to hold for the long term (at least 7-10 years). Chancellor puts the real estate cycle into five easy steps in his conclusion: (1) improvement , (2) growing confidence and prosperity, (3) excitement and overtrading, (4) convulsion, pressure, stagnation, and distress, and (5) quiescence. He believes that we are around the 4-5 range in relation to these steps. I would agree with him and add that stages 4-5 will likely last for at least a few more years to come.
