Yesterday the leading indices on Wall Straight and Europe were closed down 1%. Evidently the news from Italy is still not providing the investors as to resolve the debt crisis in Europe. New estimates of the weekend slightly lower level of fear in the markets but Europe is still not found the formula that would raise a trillion euro rescue fund and it will continue to weigh on markets in the near future. Also seems that the market will focus on Spain in the coming weeks, following bonds of the state climbed to 6%. Risks remain high and uncertainty Factors remains influential. There is an increased risk and ability to repay the debt of countries bloc. This will increase the volatility and should intervene aggressively ECB's form of purchase of bonds to lower yields.
European currency continues to be volatile. The pair locked below the 20 days moving average which are at -1.3801 dollars, hard resistance is in -1.3850-1.3840 dollars. The next support level is at -1.3483 dollars when the breaking of this level will lead to further dollar declines to 1.3350.
Investors will now focus on the debt crisis in Europe and Europe's & U.S.'s macro. At 07:00 (GMT) quarterly estimate of GDP is published in Germany when it is expected to 0.5% growth this quarter. At 9:30 (GMT) CPI will be published in the UK with an expected slight decline from last month - 5.1%. At 10:00 (GMT) ZEW survey will be published that reflects the economic sentiment in Germany. Before the trade opening, at 13:30, U.S. retail sales data will be announced with an expected 0.3%.
European currency weakened against the dollar yesterday and locked in -1.3624 dollars. Now the currency deals with the level of -1.3655 dollars - resistance level for the continued rise. Pair trading is sensitive to breaking news or market reports then we all have to be careful and wait for further progress in solving the debt problem. There is a likelihood to continue falling - up to 1.3360 dollars when support level is at -1.3480 dollars.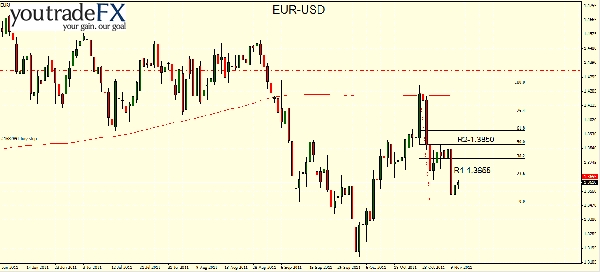
SP500
The S&P index fell by 1% and still cannot get upward momentum. The trading week is opened below the moving average of 200 days and likely will continue to shuffle around the average before deciding on a direction. Technically you can see that after the 78.6% Fibonacci correction upward – for the wave of big declines, trading began to shuffle and now trying to consolidate support around the moving average of 20 days but is still not clear what would become of him. It is likely that prices will continue to move in until we get a clearer picture of the markets. Resistance levels continued to rise in the area where the -1,271.00 points, the level of support is in the -1,217.10 points.
SILVER
Price of Silver is still supported by the moving average of 20 days and in addition the price is supported by the trend line that distinguished him from the beginning of October. In the short term, rise in inflation can be expected to support further price increases in money and gold. Silver can be bought at the current market rate when the target is located at -36.85 dollars a moving average line is 200 days. The level of stop loss can be placed under the recent low prices in levels of 32.80 dollars and -31.80 dollars.
- English (UK)
- English (India)
- English (Canada)
- English (Australia)
- English (South Africa)
- English (Philippines)
- English (Nigeria)
- Deutsch
- Español (España)
- Español (México)
- Français
- Italiano
- Nederlands
- Português (Portugal)
- Polski
- Português (Brasil)
- Русский
- Türkçe
- العربية
- Ελληνικά
- Svenska
- Suomi
- עברית
- 日本語
- 한국어
- 简体中文
- 繁體中文
- Bahasa Indonesia
- Bahasa Melayu
- ไทย
- Tiếng Việt
- हिंदी
Daily Market Analysis: Currency Report 15 November 2011
Published 11/15/2011, 12:28 PM
Updated 03/09/2019, 08:30 AM
Daily Market Analysis: Currency Report 15 November 2011
EUR/USD
Latest comments
Loading next article…
Install Our App
Risk Disclosure: Trading in financial instruments and/or cryptocurrencies involves high risks including the risk of losing some, or all, of your investment amount, and may not be suitable for all investors. Prices of cryptocurrencies are extremely volatile and may be affected by external factors such as financial, regulatory or political events. Trading on margin increases the financial risks.
Before deciding to trade in financial instrument or cryptocurrencies you should be fully informed of the risks and costs associated with trading the financial markets, carefully consider your investment objectives, level of experience, and risk appetite, and seek professional advice where needed.
Fusion Media would like to remind you that the data contained in this website is not necessarily real-time nor accurate. The data and prices on the website are not necessarily provided by any market or exchange, but may be provided by market makers, and so prices may not be accurate and may differ from the actual price at any given market, meaning prices are indicative and not appropriate for trading purposes. Fusion Media and any provider of the data contained in this website will not accept liability for any loss or damage as a result of your trading, or your reliance on the information contained within this website.
It is prohibited to use, store, reproduce, display, modify, transmit or distribute the data contained in this website without the explicit prior written permission of Fusion Media and/or the data provider. All intellectual property rights are reserved by the providers and/or the exchange providing the data contained in this website.
Fusion Media may be compensated by the advertisers that appear on the website, based on your interaction with the advertisements or advertisers.
© 2007-2025 - Fusion Media Limited. All Rights Reserved.