
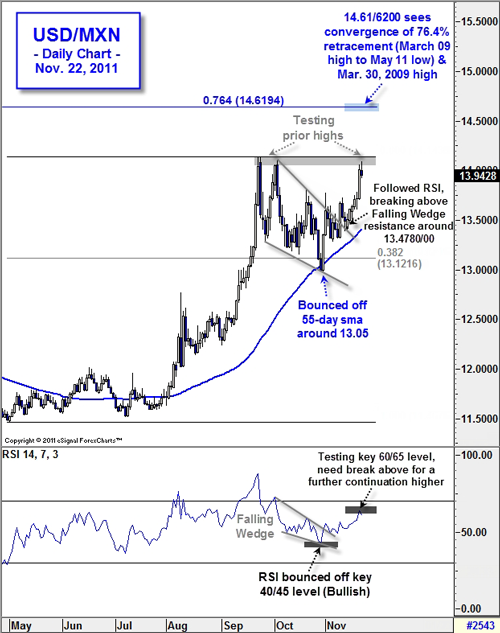
Since August I have been stating my conviction that USD/MXN’s downtrend over the past few years was coming to an end – Highlighting weekly RSI’s break above corresponding channel resistance in advance to price – See the August USD/MXN chart. As anticipated, USD/MXN broke above long-term channel resistance in early September around 12.6000 level and then continued to advance, breaking above both the highlighted 38.2 & 50% retracements – See September FX TECH LAB. However, after peaking around 14.1400 in September, the pair began to consolidate within a falling wedge pattern over the ensuing 4-6 weeks. Consequently, I made a case for further peso weakness relative to the USD at the beginning of November based on this technical pattern in addition to highlighting daily Ichimoku Cloud support, 38.2% retracement, 55-day sma, daily RSI bouncing off the key 40/45 level and a Bullish Engulfing candlestick – Read "The path of least resistance points higher". Sure enough, on Nov. 9th USD/MXN followed the daily RSI break higher as it too closed above the accentuated falling wedge resistance (13.4780). Finally, two weeks later we see the pair testing the noted September & October highs near 14.1400.
So where does it head from here? At the moment I can make an equally bullish or bearish case for USD/MXN while it holds below those noted highs, however you may want to keep a close eye on the daily RSI which is currently testing the key 60/65 level – A break above would suggest a further continuation higher, especially considering it (RSI) based in late Oct. between 40/45. If this occurs, look for USD/MXN to potentially test the converging long-term 76.4% retracement (from March 2009 high to May 2011 low) and March 30, 2009 high around 14.61/6200 over the coming days/weeks.
So where does it head from here? At the moment I can make an equally bullish or bearish case for USD/MXN while it holds below those noted highs, however you may want to keep a close eye on the daily RSI which is currently testing the key 60/65 level – A break above would suggest a further continuation higher, especially considering it (RSI) based in late Oct. between 40/45. If this occurs, look for USD/MXN to potentially test the converging long-term 76.4% retracement (from March 2009 high to May 2011 low) and March 30, 2009 high around 14.61/6200 over the coming days/weeks.