


Introduction
Forex indicators in technical analysis simplify trading. They achieve this by identifying market trends and patterns, volatility, price changes, possible entry/exit points, overbought/oversold conditions, etc. This information helps you create effective trading strategies to optimize your profits and minimize losses.

Highlights and Key Takeaways
- Forex indicators help in technical analysis.
- Some of the best forex indicators in the market are Moving Averages, MACD, RSI, Stochastic Oscillators, Bollinger Bands, ATR, On Balance Volume, and Money Flow Index.
- When used appropriately, forex indicators can help you trade successfully.
What Are Forex Indicators?
Forex indicators refer to tools that help you assess market data. They examine the various aspects of a currency pair, including past price movements, volatility, and performance in the market. Indicators then use the information to forecast future market behavior and patterns likely to be repeated.
- They can help you identify the best time to buy or sell a currency pair based on price trends and market volatility.
- Indicators may allow you to confirm a trend before initiating trades.
- By gauging the strength and speed of price fluctuations, some indicators make it possible for you to spot potential continuations or reversals in price trends.
- You can recognize chart patterns like triangles, head and shoulders, and flags and make appropriate trading decisions, thanks to indicators.
Want to customize your trading strategies? You can use one or more indicators to develop distinctive strategies that align with your trading goals. Indicators are able to spot key support and resistance levels on price charts, so you know where prices break through or bounce off. As a result, you can decide when and how to trade to maximize your income.
Key Types Of Forex Indicators
There are various types of forex indicators you can choose from. They perform different functions and offer a wide range of market information you can use to your advantage. Here are some commonly used indicators in the forex market:
Trend Indicators (Moving Averages, MACD)
Trend indicators show you the direction the market is likely to take. One of the popular indicators in this category is the Moving Average. It allows you to level out price variations and see the underlying trend.
- You determine MA by calculating the average closing price of a currency pair over a certain number of periods. The resulting MAs are then plotted on the price chart, generating a sequence of points connected to create a line graph. You can then tell the trend direction by studying the MA’s slope.
- Generally, a price above MA implies an uptrend, while a price below MA suggests a downtrend.
- MA can help you develop a viable trading idea. Let’s say you are trading the EUR/USD pair, and its chart looks like this:

- Since the current price of the pair is below the MA line, a downtrend is expected. This could be a signal for you to sell the pair.
The Moving Average Convergence Divergence (MACD) is another common trend indicator. It illustrates how the relationship of two MAs (faster and slower MAs) of a currency’s price changes over time. A downward trend is signaled when the faster MA crosses below the slower MA. An upward trend occurs when the faster MA crosses above the slower one.
- For example, if you use a chart like the one below and rely on MACD, you can implement the crossover strategy.
- In this case, the faster MACD line (blue) recently crossed the slower one (red), triggering a downward trend. However, the two lines don’t diverge, and the histogram’s size remains unchanged. This means that the downtrend isn’t strong, so it may reverse.

Momentum Indicators (RSI, Stochastics)
As the name suggests, momentum indicators measure the rate at which currency prices change. A good example of such an indicator is the Relative Strength Index (RSI), which determines the speed of price changes to establish overbought or oversold conditions.
- Typically, the RSI fluctuates between 0 and 100. An RSI reading of 50 means an equilibrium point where bullish and bearish positions match.
- An RSI of 70 or more indicates overbought market conditions, which are likely to cause a currency’s value to fall.
- RSI readings of 30 or below signify oversold conditions. In this case, there’s a high possibility of a currency’s price strengthening, which is a good opportunity to buy.
- In the chart below, for example, the RSI for the EUR/USD pair on the M15 timeframe is 33, a sign of oversold conditions. This may be the time to buy because the pair’s price could increase.

The Stochastic Oscillator is another type of momentum indicator you may find useful. It measures the extent of change between an asset’s prices from one closing period to pinpoint possible trend reversals.
- A high stochastic is present if the price of an asset closes next to its high price and keeps strengthening. Stochastic lines above 80 signal an overbought condition, with a downward market reversal looming.
- A low stochastic, on the other hand, occurs when a currency’s price closes near its low price and keeps falling. If the stochastic lines are below 20, an oversold condition is present, so an upward market reversal is expected.
- Let’s say you are trading the USD/CHF on the 1h timeframe with the chart below. As you can see, the stochastic line is high at 81, indicating an overbought condition. You may have to initiate a sell order because the currency’s price could potentially decrease.

Volume Indicators (On Balance Volume, Money Flow Index)
Volume indicators tell you whether the demand or supply of a currency pair is high or low, helping you know the side that controls price action. Examples of these indicators include On Balance Volume (OBV) and Money Flow Index (MFI). OBV is computed by summing a currency’s volume on high-volume days and deducting its volume on low-volume days.
- A day’s volume is considered high when the asset’s price closes higher than the previous day’s close. In contrast, a volume is perceived to be low when the asset closes lower than the previous day’s close.
- An increasing OBV indicates a buying interest and an uptrend, whereas a declining OBV implies a selling interest and a downtrend.
Take the example of the following chart:

- The increase in OBV tells you that many people are buying the pair, so a reversal is looming. In such a case, you may consider selling your asset.
The MFI uses prices and volume data to produce overbought or oversold signals. Like other oscillators, the MFI has a scale of 0 to 100. An oversold market is detected when the MFI is very close to 0. On the contrary, the market becomes overbought when the MFI approaches 100 (e.g., ≥80).
- You may incorporate MFI in your strategy to forecast price direction and make the necessary adjustments.
- For example, if your chart (like the one below) generates an MFI reading of 29, it might be a potential opportunity for you to buy the pair, indicating a possible strengthening of its price.

Volatility Indicators (Bollinger Bands, Average True Range)
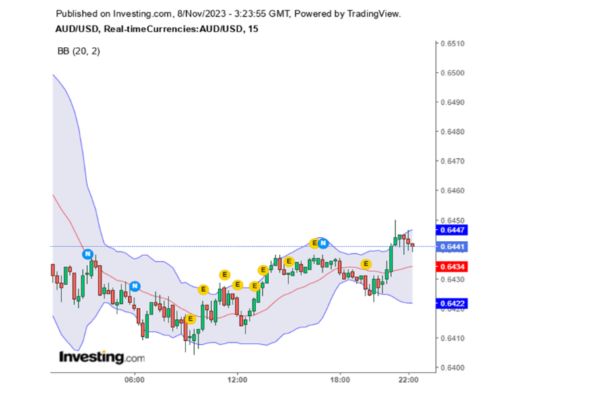
Volatility indicators help determine the extent of currency price variation during a specific period. One such indicator is the Bollinger Bands. It features 3 bands: a middle line (MA) and upper and lower bands plotted 2 standard deviations above the MA price and 2 standard deviations below the MA price, respectively.
- The bands’ width changes based on market volatility. Wide bands suggest high volatility, whereas narrow bands imply low volatility.
- Let’s use the chart below to help you understand how you can capitalize on Bollinger bands. For a while, the bands have been moving far from each other, implying high volatility. The market is very unsafe at this point, and you may have to employ risk management strategies to minimize losses.
Another volatility indicator is the Average True Range (ATR), which measures the average movement of currency pair prices within a defined period. Market volatility is considered high if the ATR value is high and vice versa.
- You can use ATR as a risk management strategy. This may entail setting stop-loss and take-profit orders based on ATR values.
- Using the chart below as an example, the ATR has been declining recently, which may insinuate that market volatility is decreasing. Therefore, you may have to set tighter stop-loss and take profit levels to adjust to smaller price changes.

Effective Use Of Forex Indicators in Trading

One of the effective ways you can use forex indicators is to study them and understand how each functions. This way, you’ll know how to apply them in your trading to increase your potential profits. Also, combine indicators to verify signals. For instance, you may mix MAs with RSI to confirm directions of trends and possible entry/exit points.
- Ensure you assess divergences between the movements of prices and indicators to identify weakening trends or impending reversals, improving the accuracy of your forecasts.
- Don’t forget to factor in other market conditions and economic events that affect currency prices even as you use indicators.
- Backtest your indicator strategies on historical data before using them in the live market to ensure they are effective. You can also adjust parameters as needed to identify the best-performing settings.
- Apply risk management measures like setting stop-loss orders and position sizing to mitigate losses from your strategies.
Work with multiple timeframes. Assess indicators on various timeframes to validate trends and align signals across many timeframes for effective trades. Manage your emotions while trading with indicators. Even if things don’t go as you projected, remain calm and adhere to your trading strategy.
Common Mistakes To Avoid While Using Forex Indicators
Don’t become too dependent on forex indicators. Although these tools can help you trade successfully, you should also integrate other factors, like news events, market sentiment, technical analysis, etc., in your analyses. This may enhance the accuracy of your predictions.
- Avoid using too many indicators at once. This can overload the chart and confuse you, leading to wrong price forecasts. Just use a few indicators that complement each other to clearly see what is happening in the market and make better trading decisions.
- Take price action seriously. Given that indicators are developed from price data, they lag behind the real price movement. It’s important you analyze price action even as you use indicator signals so you don’t make incorrect entries or miss profitable opportunities.
- Don’t overlook indicator settings. It may not always be ideal to use the default settings of indicators as they may not fit your forex trading strategy. Take time to comprehend the indicator configurations and modify them to align with your preferences.
You can easily be tempted to make a trading decision based on a signal generated by a single indicator and ignore other factors. This can lead to immense losses. In any case, remember that indicators are not for providing immediate buy or sell signals, so use them patiently and with discipline.
- Refrain from chasing after the most recent indicators. Take time to study new indicators to understand how they work and gauge their effectiveness. This will help you avoid making spontaneous and uninformed trading decisions.
- While a certain indicator may have worked perfectly for you for some time, be flexible and consider using others when market conditions change.
- Don’t ignore confirmation signals. Depending on one indicator without using others to confirm signals may be detrimental to your trading, as this can lead to premature entries/exits.
Conclusion
Forex indicators are invaluable tools you need to integrate into your trading strategy. They will not only help you study price patterns but also identify the ideal time to buy or sell your assets to maximize your returns. You can also combine different types of indicators to improve your outcomes.
As you use forex indicators, remember to exercise caution. Don’t depend on them too much because they can misguide you and cause you to incur losses. Remember to consider other factors that affect price changes to have a holistic view of a currency’s strengths and weaknesses.
FAQ
How Much Do Forex Traders Pay in Taxes?
The amount of taxes you pay depends on many factors, including your resident country, foreign currency earnings, and your country’s tax regulations. For instance, Short-term capital gains from currency trading are taxed at ordinary income tax rates, which range from 10% to 37%, based on the income level of the taxpayer. On the other hand, long-term capital gains are taxed at a lower rate, ranging from 0% to 20%.
How Do I Pay Taxes On Forex Trading?
File tax returns, which involve filling out a specific tax form provided by your country’s tax agency and highlighting your profits and losses and other expenses. The tax amount is generated by deducting your trading expenses from your trading profits. You can then pay this amount to the relevant tax agency.


