USA Momentum Stocks ETF
iShares Edge MSCI USA Momentum Factor (NYSE:MTUM) tracks the performance of US large-/mid-capitalization and higher momentum stocks.
This ETF is one of those ETFs/Indices that many are ignoring, and rightly so in a healthy market as we have major indices that most traders/investors watch closely.
I don't always look at this Momentum Factor ETF (MTUM), but I always have it close by along with my SPDR S&P 500 (NYSE:SPY), PowerShares QQQ Trust Series 1 (NASDAQ:QQQ), iShares Russell 2000 (NYSE:IWM) and so on.
With my recent assessment on the overall market, I needed a index/ETF/Sector that is showing a relative strength compare to the major indices such as S&P 500 and Dow Jones Industrial Average (because non of the major indices have reached new all-time high prices--and this has been the talk in the streets of the market).
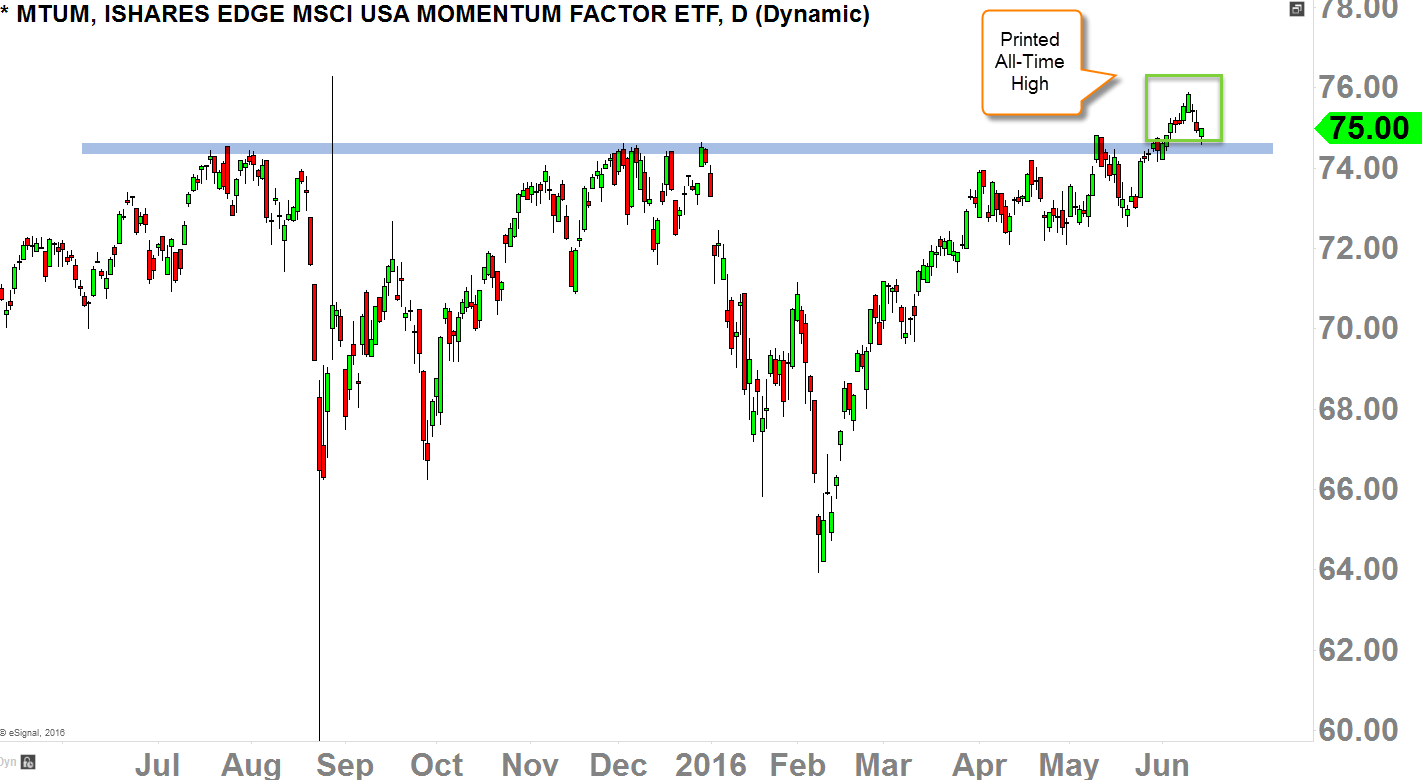
As I was going through my all of my indices watch-list, I came across this ETF just several weeks ago (in late-May) as MTUM was getting ready to print all-time high price.
When it did printed all-time high just few weeks ago, I was able to retrieve this information into my 'evidence bag' of why the major indices could follow MTUM to print all-time highs (looking at it along with other bullish data I have gathered over the last few months).
Let's take a look at the daily-chart below. Currently MTUM is retesting (after breaking above this prominent resistance just a few weeks back) $74-$75 area as a potential new-support (as it has been served as strong resistance in the past).
If MTUM bounces here and make another high, I think then, the major indices such as S&P 500 and the Dow Jones would follow and have high-level of possibility that the indices could make new all-time highs for the first time since the mid-2015.
MTUM is a close-watch index at this level.

Wilshire 5000 - Total Market Index
Unlike observing the average of 30 stocks of the Dow Jones Industrial Average or 505 stocks of US's large-cap stocks on S&P 500 Index; Wilshire 5000 Total Market Full Cap ($W5000) is a market-capitalization-weighted index that tracks all actively traded stocks in US.
This is also one of those indices that no one or no media would ever talk about, tweet about, or blog about.
I always had it on my indices list, but it been recently that I've started to track this index more closely as the overall market shook late last year.
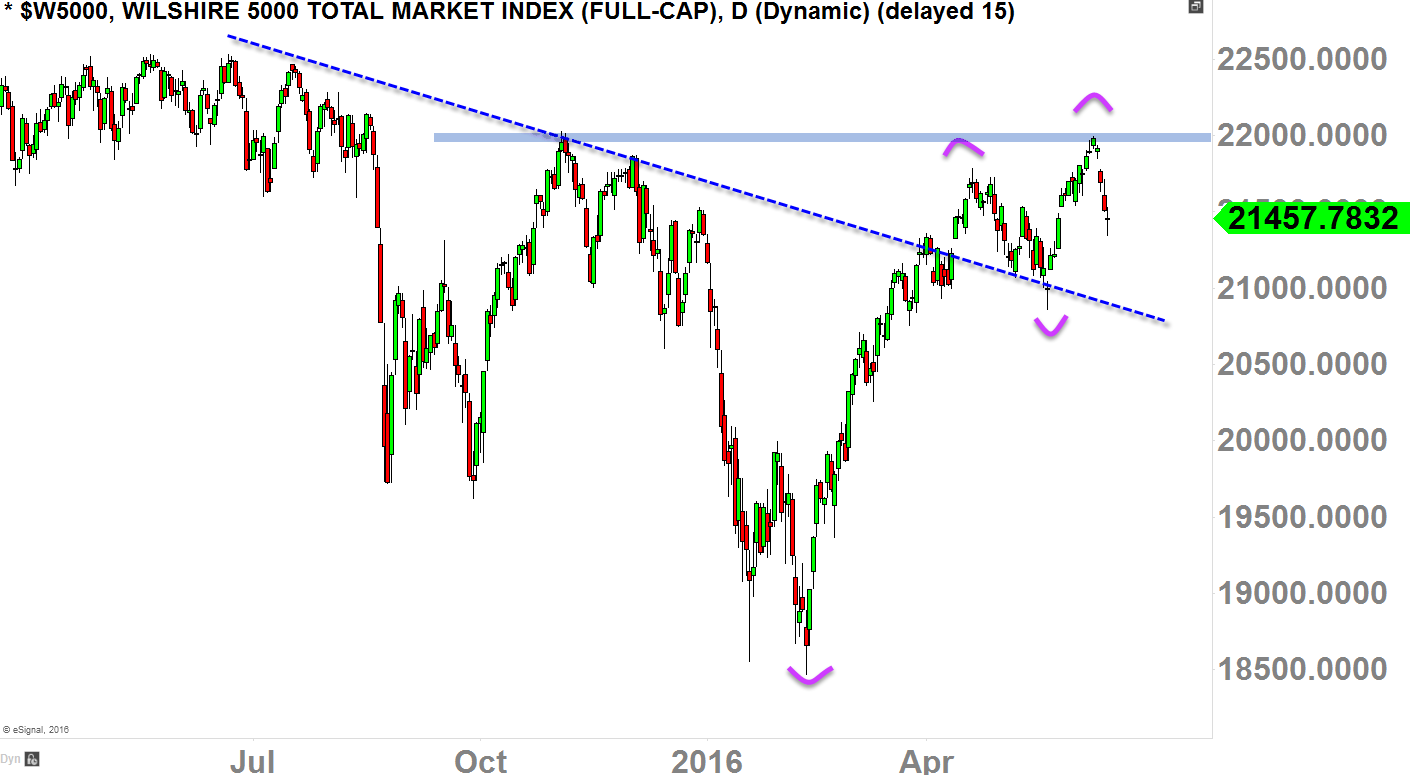
In early April of this year, I was watching to see if Wilshire 5000 could break above the downtrend-resistance (blue dotted line), and when it did, I had a whole new perspective of the major indices such as S&P 500.
I mean, I've already came to a conclusion that the market could see a strong bounce (as I've written this article in late January of this year), but with this recent price-action on Wilshire 5000, I am starting to believe that the overall market could completely shake-off the Market Crash Theorists and continue to the upside.
So let's take a look at the daily-chart below.
So obviously we talked about $W5000 breaking above the downtrend-resistance, but we have cultivated an "equal high" last Wednesday (June 8, 2016) with the November 5, 2015 swing high.
If you properly understand technical analysis, when it cultivates an "equal high" it means the downtrend is now dying and getting into a 'neutral' type of sentiment.
Then the question remains, when can the sentiment shift from 'neutral' to 'bullish;' it is when $W5000 break well-above the 22500-level which is the current horizontal-resistance (blue-shaded horizontal line) and that's the precisely the "equal high" level we've been talking about.
When/if this market clears this level of 22500-level, I would have to say then, Wilshire 5000 is now in bullish mode. But let's not get lost here with the possible scenarios, but keep our focus on the current sentiment which is now in a 'neutral' sentiment, meaning, we are no longer in a downtrend.
This his how market recovers from the correctional phases. It will reverse back up after a steep decline, but instead of cultivating a "lower high", it will cultivate an "equal high" and then the price will pullback to create/cultivate a "higher-low", and finally a "higher high:" and this phase is precisely when the inauguration of a uptrend commences.
Along with MTUM, I would watch $W5000 index closely going into next few months of trading.

