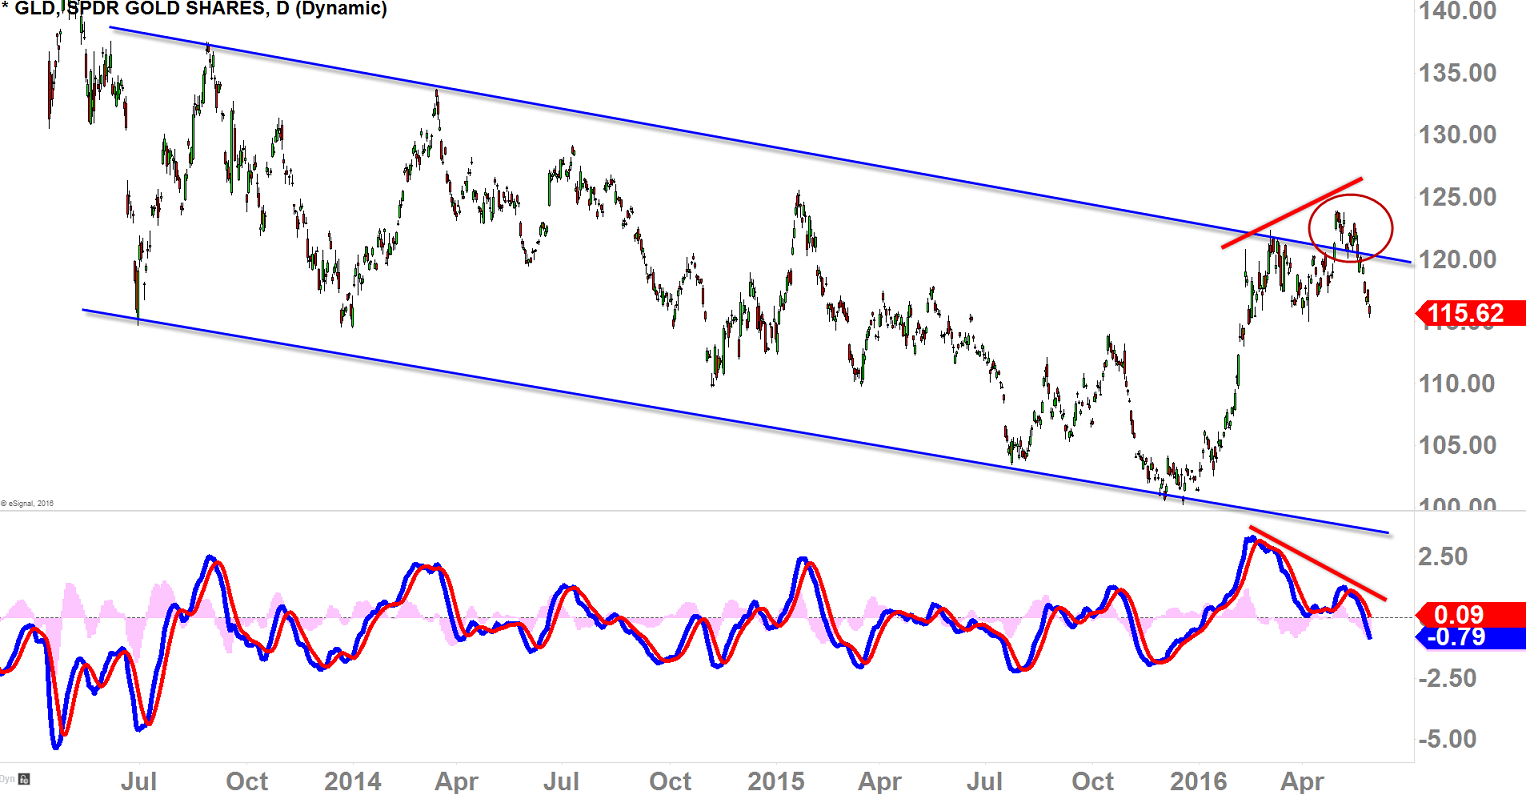
DOWNTREND CHANNEL
In early April, Gold Shares prices attempted to break above the Downtrend Channel (see red circle), if succeeded, that would've been the start of something.
But with failed breakout comes fast move to the opposite direction as we can see in the chart below.
To make things even worse for the buyers, we have formed 'bearish divergence' on the MACD oscillator I have included on the chart.
This is like spraying gas in the fire. If the price starts to decline below $115, I think the price could continue to deteriorate; in the worst case scenario, all the way back down to the bottom of the channel support at $100-95ish. 
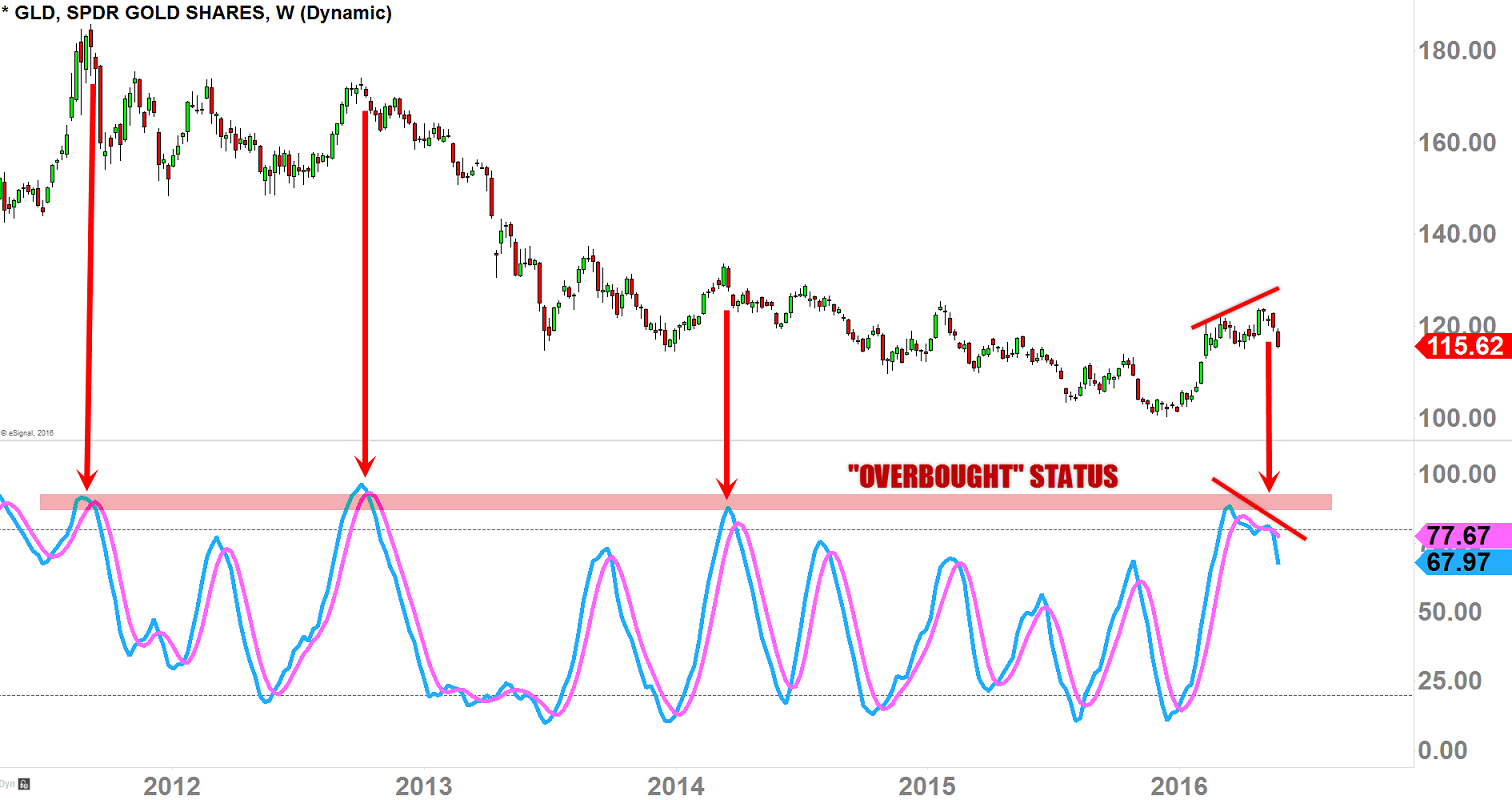
OVERBOUGHT STATUS
Looking at the weekly-chart below, we can see that the price is now falling after hitting the "overbought" status level.
Again, to make things worse, we have formed another bearish divergence on the Stochastics Oscillator shown below.
Weekly-scale divergences are actually more potent that the daily-chart above; but when they form together (daily and weekly) like this, it could be disastrous.
If we don't see buyers reclaiming the price above $120 in the next couple weeks, I think the sellers are preparing to have a party for months on Gold Shares (NYSE:GLD).
