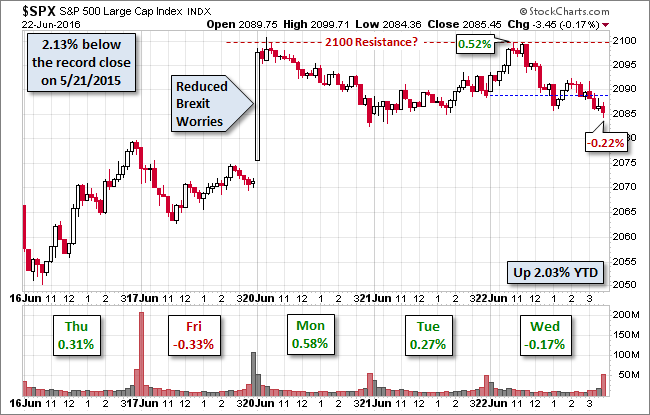
European equity indexes finished today's session mostly in the green ahead of tomorrow's big Brexit vote. The FTSE gained 0.56%, the DAX 0.55% and the CAC 0.29%. Our benchmark S&P 500 rose during the morning to its 0.52% intraday high, comparable to the FTSE close. But it then sold off in a couple of waves to its -0.22% intraday low moments before the close at -0.17%. So far this week the 2100 level has served as resistance. As for the Brexit vote drama, there's still another day of trading before we know the outcome. See this Marketwatch piece for the timetable for that information.
The 10-year note closed at 1.69%, down two basis points from the previous session.
Here is a snapshot of past five sessions in the S&P 500.
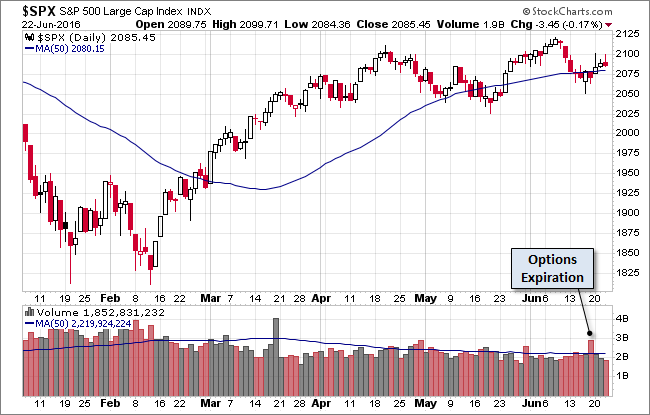
Here is a daily chart of the index. Volume on today's trade was on the light side.
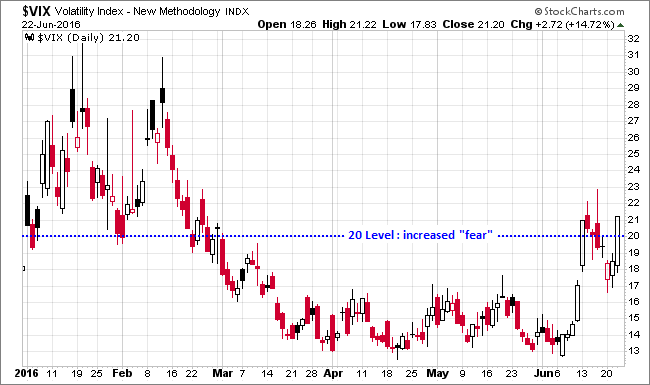
Here's a look at the VIX volatility index, the celebrated "fear gauge" market indicator, which has crept up above the 20 threshold.
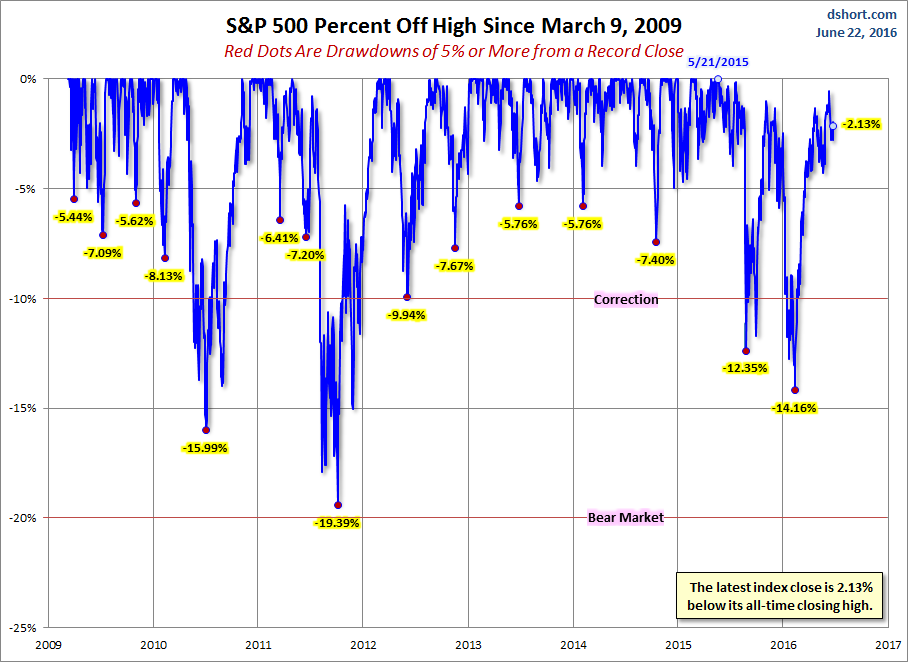
A Perspective on Drawdowns
Here's a snapshot of selloffs since the 2009 trough.
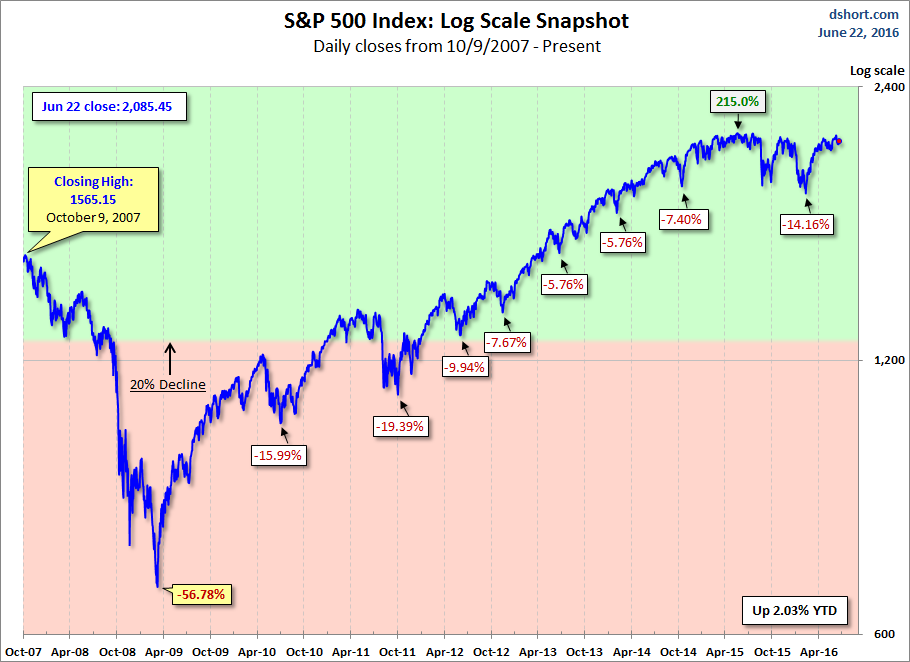
Here is a more conventional log-scale chart with drawdowns highlighted.
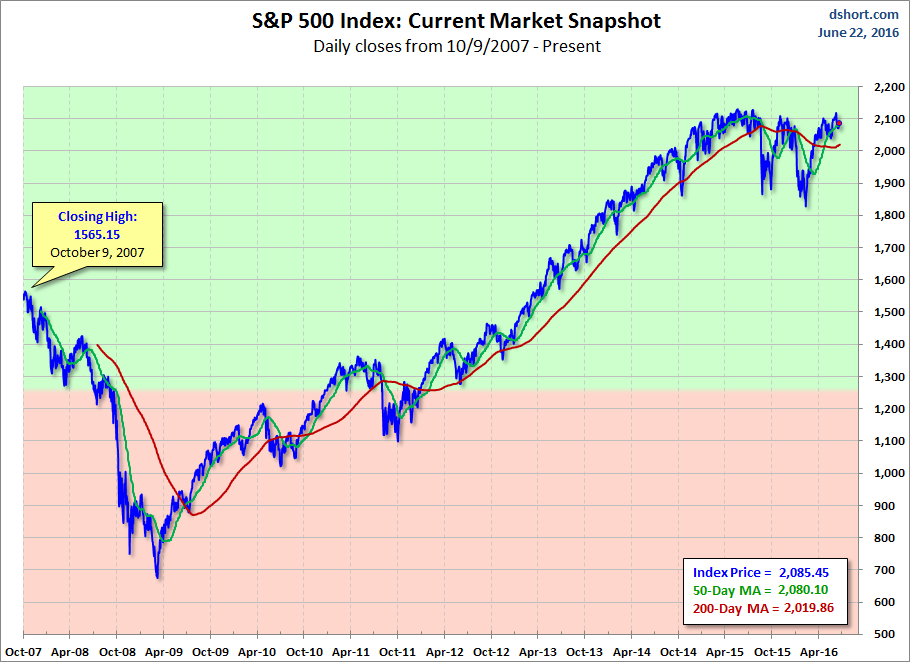
Here is a linear scale version of the same chart with the 50- and 200-day moving averages.
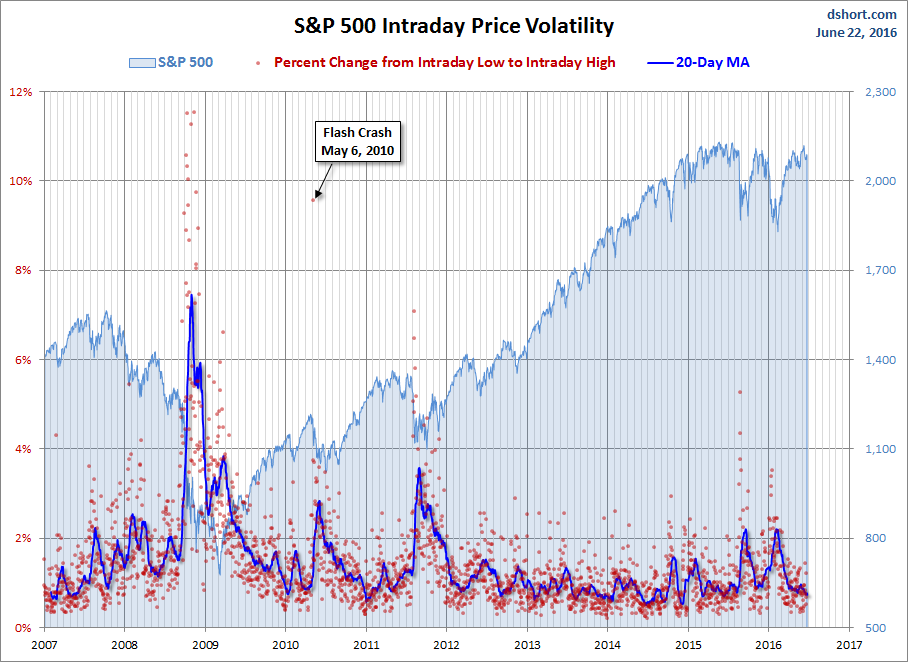
A Perspective on Volatility
For a sense of the correlation between the closing price and intraday volatility, the chart below overlays the S&P 500 since 2007 with the intraday price range. We've also included a 20-day moving average to help identify trends in volatility.
