

The term “Moving Average” might sound complex, but at its core, it’s a remarkably straightforward concept. Think of it as a financial tool that helps you cut through the noise and get to the heart of price trends. Let’s break it down.
Defining the Moving Average
A moving average (MA) is a widely used statistical indicator in financial markets that helps smooth out price data by creating a constantly updated average price. This tool is especially useful for identifying trends and making trading decisions. Moving averages are commonly used in stock trading and can apply to any asset class, including commodities, bonds, and currencies.
How is the MA Calculated?
The calculation of a Moving Average is simple: you take a specified number of past closing prices (the period) and calculate the average. As new data points come in, you continuously update this average, creating a moving line on a price chart. This line, known as the Moving Average line, represents the smoothed-out trend of the asset’s price.
For instance, if you’re looking at a 10-day Moving Average of a stock’s closing prices, you add up the closing prices of the past 10 days and divide by 10. Each day, you drop the oldest data point and add the latest, keeping the window fixed at 10 days. This process creates a dynamic line that tracks the stock’s average price over time.

Types of Moving Averages
Moving Averages (MAs) are not one-size-fits-all tools. There are several types of MAs, each with its own characteristics and applications. Understanding these different types is crucial for investors looking to harness the power of MAs effectively.
Understanding how to calculate Moving Averages (MAs) is fundamental to using them effectively in your investment analysis. While the concept of taking an average of past prices may seem straightforward, there are variations in how different types of MAs are calculated. In this section, we’ll explore the calculation methods for three common types of MAs: Simple Moving Averages (SMA), Exponential Moving Averages (EMA), and Weighted Moving Averages (WMA).
1. Simple Moving Average (SMA)
The Simple Moving Average, or SMA, is the most straightforward of the bunch. It calculates the average of prices over a specified period equally. Here’s how it works:
SMA = (Sum of Closing Prices for n Periods) / n
- Sum of Closing Prices for n Periods: Add up the closing prices for the number of periods you’re interested in (e.g., 10 days, 50 days, or 200 days).
- n: The number of data points or periods you’re averaging.
For example, to calculate a 10-day SMA, you would add up the closing prices of the past 10 days and divide by 10.
SMA Use Case:
SMAs are excellent for identifying longer-term trends. They provide a smoother line on the chart but may be less responsive to recent price changes compared to other types of MAs.

2. Exponential Moving Average (EMA)
The Exponential Moving Average, or EMA, takes a different approach. It gives more weight to recent prices, making it more responsive to current market conditions. The formula for EMA involves a weighted multiplier and a smoothing constant. Here’s the formula:
EMA = (Current Price – EMA Previous Day) x Multiplier + EMA Previous Day
- Multiplier: Calculated based on the chosen EMA period. It’s typically 2 / (1 + n), where n is the number of periods you’re using. For example, for a 10-day EMA, the multiplier would be 2 / (1 + 10) = 0.1818.
- EMA Previous Day: The EMA value calculated for the previous day.
To start the EMA calculation, you usually use the SMA as the EMA for the first period. Then, you apply the formula to calculate subsequent EMA values.
EMA Use Case:
EMAs are ideal for investors looking to capture short-term trends and react swiftly to market shifts. They are particularly popular among day-traders.

3. Weighted Moving Average (WMA)
The Weighted Moving Average (WMA) assigns different weights to each data point in the specified period. Recent data points are typically given higher weighting. The formula for WMA involves multiplying each data point by its corresponding weight, then summing up these weighted values and dividing by the sum of the weights. Here’s the formula:
WMA = [(P1 x w1) + (P2 x w2) + … + (Pn x wn)] / (w1 + w2 + … + wn)
- P1, P2, … Pn: The closing prices for each of the n periods you’re averaging.
- w1, w2, … wn: The weights assigned to each period. These weights can be based on various criteria, such as linear, exponential, or custom weightings. In a simple linear case, the weights for a 3-period WMA would be 3, 2, and 1.
For example, if you’re calculating a 3-period WMA, you’d multiply the most recent closing price by 3, the previous one by 2, and the one before that by 1. Then, you sum these values and divide by the sum of the weights.
WMA Use Case:
WMAs offer a compromise between SMAs and EMAs. They provide a smoother line than EMAs but are more responsive than SMAs. WMAs can be tailored to specific market conditions.

Choosing the Right Moving Average Type
The choice of MA type depends on your investment goals and timeframe. Here’s a quick guide:
- For Long-Term Trends: If you’re a long-term investor looking to identify significant trends, consider using SMAs with longer periods, such as 50-day or 200-day SMAs.
- For Short-Term Trends: Traders who want to capture short-term price movements should opt for EMAs with shorter periods, like 10-day or 20-day EMAs.
- Customization: WMAs offer flexibility. You can adjust the weights to create a customized moving average that aligns with your specific strategy.
Each type of Moving Average (SMA, EMA, and WMA) has its unique calculation method, which influences its responsiveness to price changes. Whether you prefer the simplicity of SMAs, the responsiveness of EMAs, or the customization of WMAs, the choice of MA type and calculation method should align with your overall investment strategy.

How Moving Averages Work
Now that we’ve grasped the basics of Moving Averages (MAs), it’s time to dive into how they work in practice. MAs are more than just lines on a chart; they are powerful tools that help investors make sense of complex price data.
1. Smoothing Out Price Data
Imagine a stock chart filled with daily price fluctuations, resembling a jagged mountain range. For investors, deciphering meaningful trends amidst this turbulence can be challenging. This is where MAs come into play.
MAs work by smoothing out this jagged terrain, creating a more manageable landscape. Here’s how they do it:
- Eliminating Noise: MAs filter out the day-to-day price fluctuations and noise, allowing investors to focus on the broader trend.
- Highlighting Trends: By removing short-term volatility, MAs reveal the underlying trend direction, whether it’s upward, downward, or sideways.
- Reducing Emotional Influence: Investors often make impulsive decisions based on short-term price swings. MAs provide a rational perspective, reducing emotional trading.
2. Visualizing Trends
One of the greatest strengths of MAs is their ability to visually represent trends. A Moving Average line on a price chart acts as a dynamic trend indicator. Here’s how it works in practice:
- Uptrend: When the price of an asset consistently stays above its MA, it signals an uptrend. This suggests that the asset is generally gaining value over time.
- Downtrend: Conversely, when the price remains consistently below the MA, it indicates a downtrend, signifying a decreasing value.
- Sideways or Range-Bound: In periods of sideways movement, where prices fluctuate within a relatively narrow range, the MA line may move horizontally, reflecting the lack of a clear trend.
3. Identifying Support and Resistance
Moving Averages are not only trend indicators but also act as dynamic support and resistance levels. This can be valuable for investors:
- Support: In an uptrend, the MA often acts as a support level. When the price approaches the MA and bounces off it, this suggests potential buying opportunities.
- Resistance: In a downtrend, the MA may act as a resistance level. When the price approaches the MA and struggles to break above it, it could indicate potential selling opportunities.
- Crossovers: Paying attention to crossovers, where the price crosses the MA, can provide insights into potential trend changes and reversals.
4. Dynamic Nature of MAs
One crucial aspect to understand about MAs is their dynamic nature. They continuously adapt to new data points. As each new price point is added, the oldest one is dropped, ensuring the MA always reflects the most recent market conditions.
This adaptability is why MAs are particularly valuable in fast-moving markets or when tracking assets with high volatility.
Why Are Moving Averages Important For Investors?
The key lies in the Moving Average calculation’s ability to reveal trends that might not be immediately apparent when looking at raw price data. Here’s why it’s important:
- Smoothing Out Noise: Financial markets are often noisy, with prices subject to constant volatility and fluctuations driven by news, sentiment, and day-to-day trading. MAs cut through this noise, offering a clearer view of the underlying trend.
- Trend Identification: MAs help investors identify whether an asset’s price is in an uptrend, downtrend, or moving sideways. This information is invaluable for making informed investment decisions. Here’s why MAs excel at this:
- Uptrend Confirmation: When the price consistently remains above the MA, it confirms an uptrend. Investors can use this information to identify potential buying opportunities in assets with strong upward momentum.
- Downtrend Alert: Conversely, when the price stays below the MA, it signals a downtrend. This can serve as an early warning for investors to consider selling or avoiding assets on a downward trajectory.
- Sideways Movement: MAs can also highlight periods of consolidation or sideways movement. In such cases, they help investors recognize that a clear trend may be absent, which can influence their strategy.
- Support and Resistance Levels: Moving Averages often act to show dynamic support or resistance levels. When an asset’s price approaches or crosses a Moving Average, it can signal potential price reversals.
- Risk Management: Investing always involves an element of risk, but MAs can help manage that risk more effectively:
- Stop-Loss Placement: MAs can assist in setting reasonable stop-loss levels. For example, if you’re holding a stock in an uptrend, you might choose to place your stop-loss slightly below the MA. This can protect your gains while allowing room for normal price fluctuations.
- Identifying Reversals: When a price crosses below the MA in an uptrend or above the MA in a downtrend (known as a “crossover”), it can indicate a potential trend reversal. Recognizing these early can help investors exit positions before significant losses occur.
- Decision-Making: Investors use MAs to make decisions like buying or selling assets. The interaction between the asset’s price and its Moving Averages can trigger trading signals. For instance:
- Entry Points: Investors frequently use MAs to identify favorable entry points. For instance, buying when the price crosses above the MA in an uptrend can be a compelling entry signal.
- Exit Points: Similarly, MAs can guide exit decisions. If you’re holding a position and notice a bearish crossover (price crossing below the MA in an uptrend), it might be a signal to consider selling.
- Objective Analysis: Instead of relying solely on gut feelings or emotions, investors can base their decisions on the objective information presented by MAs.
- Consistency: MAs offer a consistent method for analyzing assets across various markets and timeframes. This consistency can be reassuring for investors.
In essence, Moving Averages are like a financial compass, providing direction and clarity for both new and seasoned investors. As we continue through this guide, we’ll explore different types of Moving Averages, how they work, and most importantly, how they can be a powerful tool in your investment toolkit.
How To Choose The Right Moving Average Timeframe
The timeframe you choose for your MAs can significantly impact the insights you gain from them. Selecting the appropriate MA timeframe depends on your investment goals, risk tolerance, and trading style. Here are some considerations:
- Day Trading: If you’re a short-term trader, focus on short-term MAs like the 10-day or 20-day. These will provide insights into rapid price movements. Short-term MAs typically cover periods ranging from a few days to a few weeks.
- Swing Trading: For swing traders, intermediate-term MAs like the 50-day or 100-day are often preferred. They capture trends that last several weeks or months and strike a balance between responsiveness and smoothing out noise.
- Long-Term Investing: If your goal is long-term investing, long-term MAs like the 200-day or 365-day offer insights into the overall health of an investment and help identify long-term trends which may include annual seasonality. Long-term MAs are essential for investors who prioritize the big picture and aim to stay in investments for the long haul.
Can Multiple Timeframes Be Combined?
Some investors choose to combine multiple MAs of different timeframes to gain a more comprehensive view. For instance, you might use a 50-day and a 200-day MA simultaneously. When the shorter MA crosses above the longer MA, it can signal a potential bullish trend change.
How To Interpret Moving Average Crossovers
One of MA’s most powerful applications is in interpreting crossovers, a technique that can provide valuable insights into potential trend changes and investment opportunities. In this section, we’ll look closely at Moving Average crossovers and how they can enhance your decision-making process.
The Significance of Crossovers
A Moving Average crossover occurs when the asset’s price crosses above or below the Moving Average line. This event is significant because it reflects a shift in the asset’s momentum. Here’s what these crossovers mean:
- Bullish Crossover: When the price crosses above the MA, it’s known as a bullish crossover. This suggests a potential uptrend or a strengthening of the existing uptrend.
- Bearish Crossover: Conversely, when the price crosses below the MA, it’s called a bearish crossover. This indicates a potential downtrend or a deepening of the existing downtrend.
Crossovers are like traffic signals for investors, guiding them on whether to proceed with their current positions, consider buying, or contemplate selling.
The Golden Cross and the Death Cross
Within the realm of Moving Average crossovers, two specific crossovers hold particular significance:
- Golden Cross: This is a bullish signal that occurs when a short-term MA (e.g., a 50-day MA) crosses above a long-term MA (e.g., a 200-day MA). It suggests the potential for a significant uptrend and is often seen as a buy signal.
- Death Cross: Conversely, the Death Cross is a bearish signal. It occurs when a short-term MA crosses below a long-term MA. This crossover suggests the potential for a significant downtrend and can be interpreted as a sell signal.
These crosses are powerful because they reflect shifts in market sentiment and can guide investors in making timely decisions.
Using Crossovers in Practice
While the concept of crossovers is clear, using them effectively requires a strategic approach. Here are some practical tips:
- Confirmation: Don’t rely solely on crossovers. Use them in conjunction with other indicators or analysis methods to confirm signals.
- Timeframe Matters: The significance of a crossover can vary based on the timeframe you’re analyzing. A golden cross on a daily chart may have different implications than one on a weekly chart.
- Avoid False Signals: Not all crossovers lead to significant trends. Be cautious of false signals, especially in choppy or sideways markets.
- Risk Management: Always have a risk management strategy in place. Crossovers can help you time your entries and exits, but they are not foolproof.
Customizing Crossovers
Some investors prefer to customize crossovers to fit their specific strategies. For instance, you can use multiple MAs of different periods to identify short-term and long-term crossovers. Experimenting with different combinations can help you tailor crossovers to your unique investment approach.
Real-World Application
To illustrate the power of crossovers, consider a scenario where you’re holding a stock that has been on an uptrend for months. If you notice a golden cross (short-term MA crossing above the long-term MA), it can be a compelling signal to stay invested or even consider adding to your position, depending on other factors like market conditions and fundamentals.
Conversely, if you’re holding a stock and see a death cross in a bearish market, it might be a sign to consider selling or tightening your stop-loss levels.

How To Use Moving Averages in Your Investment Strategy
Now that we’ve explored the intricacies of Moving Averages, it’s time to bring it all together. In this section, we’ll discuss practical ways to integrate MAs into your investment strategy to enhance your decision-making process and improve your chances of success.
1. Define Your Investment Goals
Having a clear investment goal will influence the timeframe used for your MAs. Are you looking for short-term gains through active trading, or are you a long-term investor seeking to build wealth steadily over time?
- Short-Term Goals: If you aim for short-term gains, focus on shorter-term MAs (e.g., 10-day or 20-day) to capture rapid price movements.
- Long-Term Goals: For long-term wealth accumulation, consider longer-term MAs (e.g., 200-day or 365-day) to identify and stay aligned with the broader trend.
2. Create a Solid Trading Plan
A well-structured trading plan is the backbone of successful investing. Your plan should include entry and exit strategies, risk management rules, and criteria for using MAs. Here’s what to include:
- Entry Points: Define clear criteria for entering a trade or investment based on MAs, such as bullish crossovers or price proximity to MAs.
- Exit Points: Establish criteria for exiting a trade, which may include bearish crossovers, price reaching a certain level relative to MAs, or specific profit targets.
- Position Sizing: Determine the size of each position based on your risk tolerance and the size of your portfolio.
3. Combine MAs with Other Indicators
While MAs are powerful on their own, combining them with other technical indicators can provide more comprehensive insights. Consider using:
- Relative Strength Index (RSI): To assess overbought or oversold conditions in conjunction with MA signals.
- Volume Analysis: To confirm price movements and identify the strength of trends.
- Bollinger Bands: To visualize price volatility and potential reversals alongside MAs.
4. Stay Informed About Market Events
Market events, such as economic releases, earnings reports, and geopolitical developments, can impact prices and override MA signals. Stay informed about significant events that could influence your investments.
5. Monitor and Review
Regularly monitor your investments and review your trading plan. Make adjustments as needed based on your experiences and the performance of your MA-based strategies. If you’re uncertain about your investment decisions or need guidance on integrating MAs into your strategy, consider seeking advice from a financial advisor or professional with expertise in technical analysis.
Pros and Cons of Using Moving Averages for Investors
Moving Averages (MAs) are versatile tools that offer several advantages to investors. However, like any analytical technique, they also come with their fair share of limitations.
Advantages of Using Moving Averages
1. Trend Identification
MAs excel at identifying trends in asset prices. They smooth out noise and provide a clear visual representation of whether an asset is in an uptrend, downtrend, or moving sideways. This helps investors make informed decisions based on the prevailing market sentiment.
2. Simplified Analysis
MAs simplify the process of analyzing price data. They condense historical price information into a single line on a chart, making it easier for investors to grasp and interpret. This simplicity is particularly valuable for time-poor investors who need quick insights.
3. Objective Decision-Making
MAs provide a structured and objective approach to decision-making. Rather than relying on gut feelings or emotions, investors can base their actions on concrete data and signals generated by MAs. This can help reduce the impact of psychological biases in trading and investing.
4. Timing Entry and Exit
MAs help investors time their entry and exit points. By using MAs to identify potential trend changes and crossovers, investors can enter positions at opportune moments and exit before substantial losses occur. This can enhance overall portfolio performance.
5. Risk Management
MAs play a role in risk management by assisting in setting stop-loss levels and determining appropriate position sizes. This helps investors limit potential losses and protect their capital.
Disadvantages of Using Moving Averages
While Moving Averages (MAs) are powerful tools for investors, they are not without their pitfalls. Understanding and avoiding these common traps is crucial for making informed and successful investment decisions.
1. Lagging Indicators
MAs are lagging indicators, meaning they rely on historical price data. This lag can result in delayed signals, causing investors to miss out on some price movements, especially in fast-moving markets. Market conditions change, and what works well with a short-term MA (for example) in one situation might not work in another.
Avoidance Tip: Be flexible with your MA timeframes. Consider using multiple MAs of different periods to gain a more comprehensive view of the market, but keep in mind that past performance does not promise future gain.
2. False Signals
MAs are not infallible and can generate false signals, especially in choppy or sideways markets. Relying solely on MAs without additional confirmation can lead to poor decision-making.
Avoidance Tip: Seek confirmation from other indicators or use additional criteria before making significant investment decisions based on MA signals. Be patient and avoid knee-jerk reactions.
3. Less Effective in Certain Markets
MAs can be highly effective when used in the right market context, but they can lead to misjudgments if market conditions are not considered, such as in highly volatile or range-bound markets. In these cases, MAs can produce erratic signals and fail to provide useful insights. For example, using MAs in a strongly trending market may yield different results than in a sideways or range-bound market.
Avoidance Tip: Always analyze the broader market context. Consider factors such as market volatility, economic conditions, and news events when interpreting MA signals.
4. Lack of Fundamental Analysis
MAs focus solely on price data and do not consider fundamental factors. MAs can indicate trends, but they don’t provide insights into a company’s financial health, competitive position, or industry dynamics. Ignoring these fundamental aspects of investing can lead to incomplete analysis.
Avoidance Tip: Combine your technical analysis with fundamental research. This holistic approach can provide a more complete picture of an investment opportunity.
5. Over-Reliance
Investors can become overly reliant on MAs, neglecting other critical forms of analysis. Over-reliance on any single indicator can limit the effectiveness of a comprehensive investment strategy.
Avoidance Tip: Use MAs in conjunction with other technical indicators, fundamental analysis, and market research. This comprehensive approach can help you make more well-rounded decisions.
6. Influence of Outliers
One significant limitation of moving averages is their susceptibility to outliers. Outliers can heavily skew the average, resulting in a distorted representation of the data. For example, if a stock price spikes due to an anomalous event, the moving average will be influenced by this outlier, potentially misleading investors about the true trend.
7. Unsuitability for Cyclical Data
Moving averages may not be suitable for all types of data, especially those with cyclical patterns. If the data follows a regular cycle, such as daily, weekly, or monthly fluctuations, the window size of the moving average might not align with these cycles. This misalignment can result in inaccurate smoothing and misleading trends.
8. Variability Across Time Periods
The trend indicated by a moving average can vary significantly depending on the time period chosen. For example, a 50-day moving average might suggest an uptrend, while a 200-day moving average might show a long-term downtrend. This variability can create conflicting signals for investors.
How to Find Moving Average?
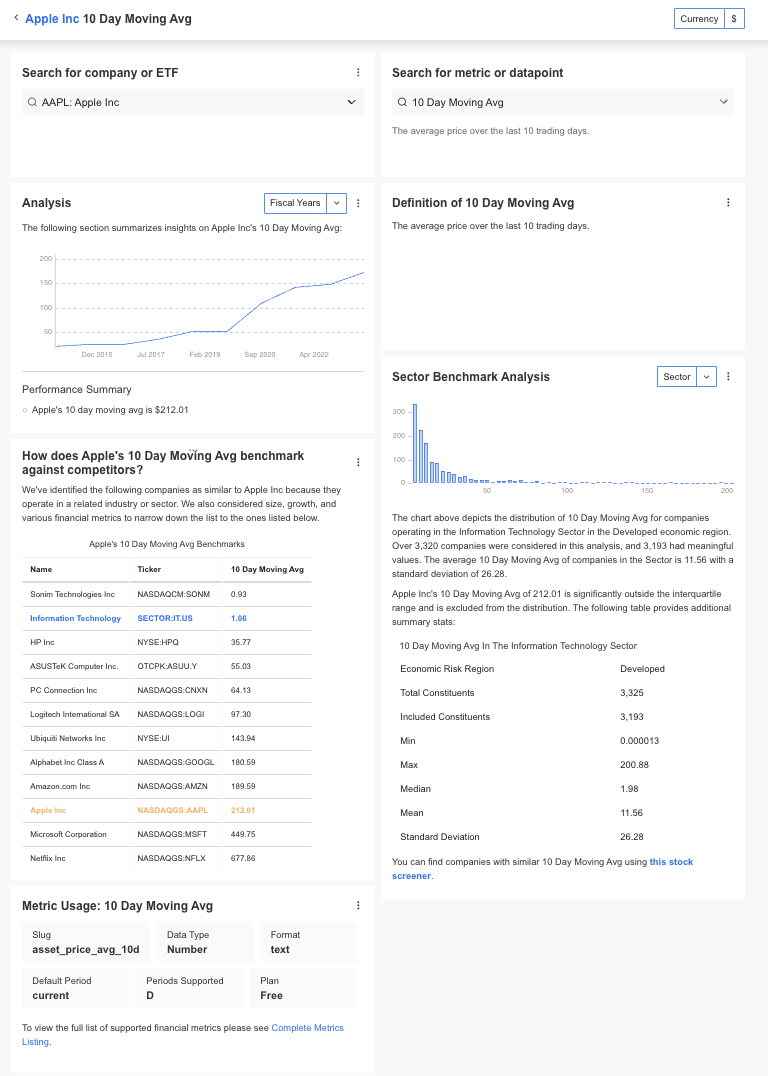
InvestingPro offers detailed insights into companies’ Moving Average including sector benchmarks and competitor analysis. In the image below, Apple Inc stock’s 10-day moving average is shown.
Wrapping Up
Moving Averages are valuable tools for investors, offering advantages such as trend identification, simplified analysis, and objective decision-making in order to time their entry and exit points, and manage risk. However, they also have limitations, including lagging signals, potential false alarms, and ineffectiveness in certain market conditions. To maximize the benefits of MAs while mitigating their drawbacks, investors should use them in conjunction with other analysis methods and exercise prudent judgment in their application.
InvestingPro: Supporting Investors of All Levels
Unlock Premium Data With InvestingPro 📈💸
Gain instant access to over 1,200 fundamental metrics for thousands of listed companies. Plus:
✓ Competitor comparison tools
✓ Evaluate stocks with 14+ proven financial models
✓ Copy stock picks and weightings from top investors (including Warren Buffett)
✓ Use filters to find stocks that perfectly match your strategy
Moving Average Frequently Asked Questions:
Q. Are there any free tools or software for calculating Moving Averages?
Yes, there are free charting and analysis platforms that offer Moving Average tools. The Moving Average Tool from investing.com allows users to customize the type and parameters of Moving Averages for both individual stocks and indices.
Q. What are the potential drawbacks of relying solely on Moving Averages for investment decisions?
Relying solely on MAs can lead to delayed or false signals, especially in volatile or range-bound markets. It may also neglect fundamental factors and limit the effectiveness of a comprehensive investment strategy.
Q. How frequently should I update my Moving Average analysis?
The frequency of updates depends on your investment timeframe. Short-term traders may update MAs daily, while long-term investors might do so weekly or monthly. It’s essential to align your update frequency with your investment goals.
Q. Can Moving Averages be used for analyzing cryptocurrency markets?
Yes, MAs are applicable to cryptocurrency markets as well. They can help traders and investors identify trends, potential entry and exit points, and manage risk in the same way they do for traditional financial markets.
Q. Are there any famous investors who have credited their success to using Moving Averages?
While many successful investors use technical analysis, it’s less common for them to credit their success solely to Moving Averages. Instead, they often combine MAs with other tools and strategies as part of their overall approach.
Q. Are there any advanced strategies for using Moving Averages in options trading?
Yes, advanced options traders may use MAs in combination with options strategies to identify potential opportunities. For example, they might use MAs to time option trades or to inform decisions about options strategies like covered calls or protective puts. However, options trading involves complex risk management and strategy considerations beyond MAs.
Q. What Is the Difference Between SMA and EMA?
The primary difference is in the weighting. SMA assigns equal weight to all data points, while EMA gives more importance to recent prices, making it more responsive to new information.
Q Why Are Moving Averages Important in Trading?
Moving averages help smooth out price data, making it easier to identify trends, reversals, and potential trade signals. They are crucial for developing trading strategies and making informed decisions.
Q. Can Moving Averages Predict Market Trends?
While moving averages do not predict future prices, they help identify the direction and strength of current trends, which can be indicative of future market behavior.
Q. What Are Common Time Frames for Moving Averages?
Traders commonly use 10-day, 50-day, and 200-day moving averages. Shorter time frames are typically used for short-term trading, while longer time frames are favored for long-term investment strategies.


