


What is a Short Interest Ratio?
The short interest ratio (SIR) is a key financial metric that reflects market sentiment by measuring the relationship between short interest and trading volume for a stock. This ratio provides investors with insights into how bearish or optimistic market participants are about a specific stock or market sector.
How to Calculate Short Interest Ratio?
The formula to calculate the short interest ratio is:
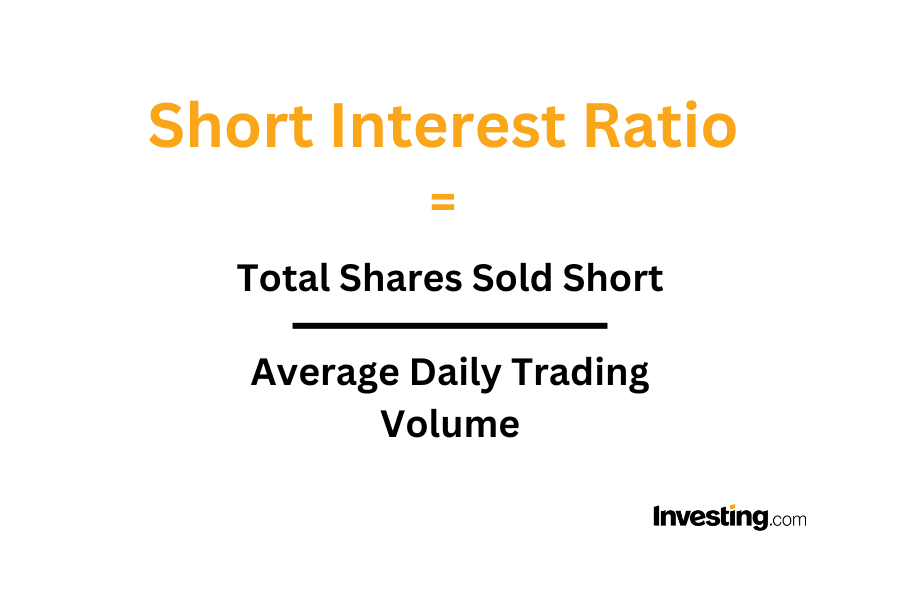
Short Interest Ratio (SIR) = Total Shares Sold Short / Average Daily Trading Volume
In this formula,
- Total Shares Sold Short: This is the total number of shares that investors have borrowed and sold with the expectation that the price will decrease.
- Average Daily Trading Volume: This refers to the average number of shares traded daily over a given period.

Example Calculation of Short Interest Ratio
Consider a publicly traded company, XYZ Corp., that is attracting attention from both bullish and bearish investors. The following data is available for XYZ Corp.:
- Total Shares Sold Short: 3,000,000
- Average Daily Trading Volume: 500,000 shares
Calculating short interest ratio:
SIR = Total Shares Sold Short / Average Daily Trading Volume
SIR = 3,000,000 / 500,000 = 6
This means the short interest ratio for XYZ Corp. is 6. The SIR of 6 indicates it would take six trading days for all short-sellers to cover their positions, assuming the average daily trading volume remains consistent.
This provides several insights:
Bearish Sentiment
The relatively high SIR suggests significant bearish sentiment among investors. A large number of shares being shorted compared to the daily trading volume indicates that many market participants are expecting the stock price to decline.
Risk of Short Squeeze
If XYZ Corp. announces unexpectedly positive news (e.g., strong earnings or a breakthrough product), the stock price could rise, triggering a short squeeze. Short-sellers may rush to cover their positions, creating increased demand and further driving up the stock price.
Liquidity Implications
A high SIR also highlights potential liquidity challenges. It could be difficult for short-sellers to exit their positions quickly without significantly impacting the stock price.
Adjusting for Updated Data
Let’s extend the example by assuming new data becomes available:
- Updated Total Shares Sold Short: 2,000,000
- Updated Average Daily Trading Volume: 1,000,000 shares
Recalculate the SIR using the updated figures:
SIR = 2,000,000 / 1,000,000 = 2
The new SIR of 2 indicates it would now take only two trading days to cover the shorted shares. This reflects a reduced level of bearish sentiment or increased market liquidity.
Why is SIR Important?
Short Interest Ratio (SIR) is a commonly used tool for evaluating the degree of pessimism surrounding a stock. It is a powerful tool for understanding market sentiment, assessing risk, and identifying potential trading opportunities.
The short interest ratio is used as a sentiment indicator, providing valuable insights into market dynamics. It serves multiple purposes for different types of investors:
- Technical Analysis: Traders may use SIR to identify overbought or oversold conditions. A sudden change in the ratio can signal shifts in sentiment.
- Fundamental Analysis: Long-term investors might consider SIR alongside company fundamentals to validate their investment theses.
- Risk Assessment: High short interest can indicate heightened risks, prompting investors to proceed with caution.
How to Interpret Short Interest Ratio?
By calculating and analyzing the short interest ratio, investors can gain a clearer understanding of market sentiment and position themselves strategically, as high short interest can indicate skepticism, while low short interest often suggests confidence in a stock’s future performance.
High SIR: A high ratio indicates significant bearish sentiment, as more shares are being shorted relative to average trading volume. This can signal potential risks, such as a short squeeze if stock prices unexpectedly rise.
Low SIR: A low ratio suggests bullish sentiment, indicating that fewer investors are betting against the stock.
While high short interest can raise caution, it doesn’t necessarily mean a stock will underperform. Similarly, low short interest doesn’t guarantee success.
Short Interest Ratio and Market Movements
The short interest ratio plays a pivotal role in understanding potential price movements:
Short Squeezes
When a heavily shorted stock begins to rise in price, short sellers may rush to cover their positions by buying back shares. This increased demand can drive prices even higher, creating a short squeeze.
Bearish Sentiment
A high SIR often indicates skepticism about a stock’s valuation or future performance. However, excessive bearishness can sometimes signal undervaluation, providing opportunities for contrarian investors.
Liquidity Insights
The ratio also helps gauge liquidity risks. Stocks with a high SIR might face limited liquidity if trading volume is insufficient to meet the demand for covering short positions.
Factors Influencing Short Interest Ratio
Several factors can affect a stock’s short interest ratio, including:
- Market Sentiment: Economic or industry-specific developments can influence the collective outlook on a stock.
- News and Events: Earnings reports, regulatory changes, or major announcements often impact short-selling activity.
- Stock Characteristics: Stocks with high volatility or speculative appeal are often targets for short-selling, which may elevate their SIR.
What are the Limitations of SIR?
Although widely used, the SIR has certain limitations:
- Time Lag: Short interest data is not updated in real time, which can make the ratio less effective in rapidly changing markets.
- Not Standalone: It must be analyzed alongside other metrics to gain a complete picture of market conditions.
- Industry-Specific Variances: The significance of a high or low SIR can vary by industry, requiring context-specific analysis.
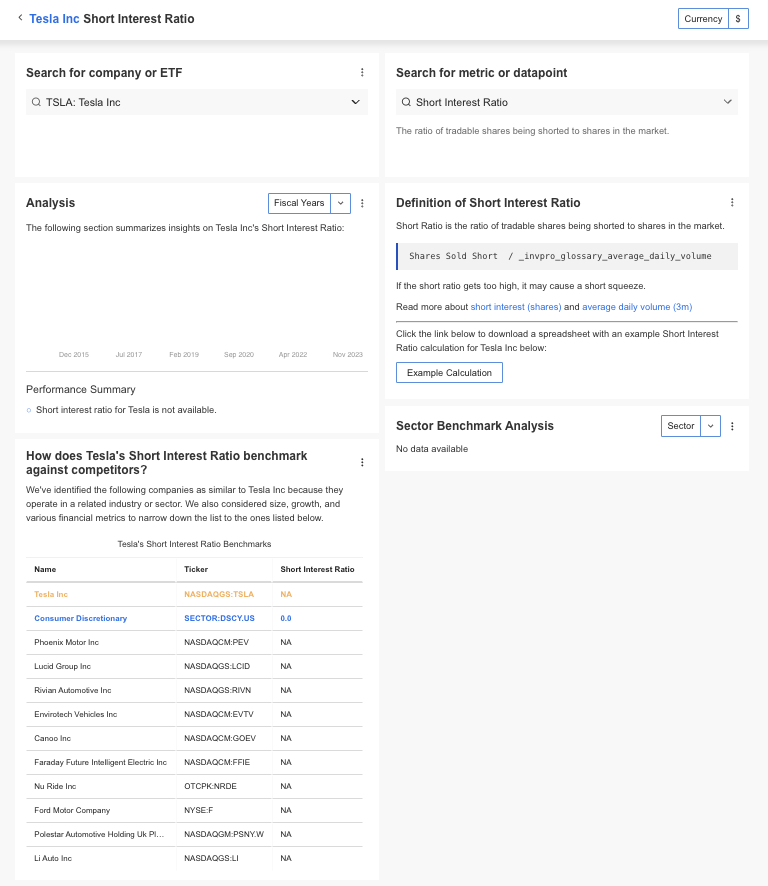
How to Find a Short Interest Ratio?
InvestingPro offers detailed insights into companies’ Short Interest Ratio including sector benchmarks and competitor analysis.
InvestingPro: Access Short Interest Ratio Data Instantly
Unlock Premium Data With InvestingPro 📈💸
Gain instant access to Short Interest Ratio data within the InvestingPro platform
🛠 Access to 1200+ additional fundamental metrics
🔍 Competitor comparison tools
📊 Evaluate stocks with 14+ proven financial models
Short Interest Ratio FAQ
What is considered a high short interest ratio?
A short interest ratio above 5 is generally considered high, meaning it would take more than five days of average trading volume to cover all shorted shares.
How often is short interest updated?
Short interest data is typically updated every two weeks, although the frequency may vary depending on the stock exchange.
Can the short interest ratio predict stock prices?
The short interest ratio provides insights into market sentiment but does not directly predict price movements. It should be used in conjunction with other indicators.
What is a short squeeze?
A short squeeze occurs when a stock’s price rises unexpectedly, forcing short sellers to cover their positions, which drives the price even higher.
How does SIR differ from short interest percentage?
While SIR measures the relationship between shorted shares and trading volume, short interest percentage reflects the proportion of shorted shares relative to a stock’s total float.


