


Revenue per share (RPS) is a financial metric used to assess a company’s revenue generation on a per-share basis. This figure is significant because it gives investors a way to understand how much revenue a company is generating for each outstanding share of stock. Unlike revenue itself, which is a broad measure of total earnings, RPS divides total revenue by the number of outstanding shares, offering a more granular perspective on a company’s financial health and performance.
In essence, RPS helps investors evaluate how effectively a company is generating revenue relative to its shares. It is especially useful when comparing companies within the same industry or assessing a company’s performance over time.
The formula for calculating Revenue Per Share is relatively straightforward:

Revenue Per Share = Total Revenue / Shares Outstanding
In this formula,
- Total Revenue refers to the company’s total sales or income generated over a specific period, such as a fiscal quarter or year.
- Shares Outstanding refers to the number of shares that are currently held by all shareholders, including institutional investors, retail investors, and company insiders.

Let’s consider that Company XYZ is a publicly traded company that has just reported its annual financial results. Below are the key figures from the company’s income statement and balance sheet:
- Total Revenue (Annual Sales): $5,000,000
- Shares Outstanding (The number of shares of stock currently in circulation): 1,000,000
Now, let’s walk through the process of calculating Revenue Per Share (RPS) using these figures.
Identify Total Revenue
The total revenue of the company is the income generated from its business activities, excluding any expenses. For Company XYZ, this figure is:
Total Revenue = 5,000,000 (This represents the total sales for the year.)
The number of shares outstanding is the total number of shares that are currently held by all shareholders, including institutional investors, retail investors, and insiders. For Company XYZ, the number of shares outstanding is:
Shares Outstanding = 1,000,000
Calculate RPS
RPS = Total Revenue / Shares Outstanding = 5,000,000 / 1,000,000
RPS = 5
Company XYZ’s Revenue Per Share (RPS) is $5. This means that for each share of Company XYZ, the company generated $5 in revenue over the course of the year. This information can help investors assess whether the company is generating sufficient revenue to support its market valuation.
Revenue Per Share (RPS) is an important financial metric for investors and analysts, offering a clear view of a company’s ability to generate revenue relative to its outstanding shares. It provides valuable insights into the company’s revenue generation efficiency and is often used alongside other financial ratios to assess overall performance.
Below, we explore the key reasons why RPS holds such significance.
- Indicator of Revenue Efficiency: RPS reflects how effectively a company generates revenue per share. A higher RPS indicates better capital utilization, making it valuable for comparing companies within the same industry.
- Comparison Across Time: Tracking RPS over time helps gauge a company’s growth and market strategy. Rising RPS suggests successful expansion, while a decline may indicate stagnation or challenges.
- Evaluating Company Performance: RPS provides a clear, non-manipulable metric of financial health. Unlike profit-based metrics, it’s unaffected by accounting practices, showing how much revenue a company generates per share.
- Support for Valuation: RPS adds depth to a company’s valuation. It’s especially useful for companies not yet profitable but showing strong revenue potential, aiding in relative valuation comparisons.
- Effect of Share Issuances: RPS highlights the impact of new share issuances. If RPS falls after an offering, it may suggest the company isn’t effectively leveraging the new capital to generate additional revenue.
The interpretation of Revenue Per Share depends on several factors, including industry norms, company growth, and historical performance. Here are a few key points to consider:
- Growth Trend: A rising RPS over time generally signals that a company is growing its revenue more efficiently. This could be a sign of strong management, a growing market presence, or successful product innovation.
- Comparing to Peers: When comparing RPS across companies in the same industry, a higher RPS could indicate better revenue generation relative to competitors. However, it’s important to compare similar-sized companies and consider the impact of external factors such as market conditions or regulatory changes.
- Impact of Share Issuance: If a company issues more shares (for example, through a stock offering), its RPS might decrease, even if its total revenue remains the same. Therefore, a declining RPS is not always an indication of a problem with the company’s operations; it could simply reflect changes in the number of shares outstanding.
- Link to Profitability: While RPS is useful in understanding how much revenue a company is generating per share, it doesn’t provide information about profitability. A company with a high RPS might still be unprofitable if its expenses exceed its revenue.
A “good” Revenue Per Share depends on several factors, including industry standards, the company’s growth stage, and its historical performance. Generally, a higher RPS is better, but it’s important to consider the following:
- Historical Performance: Comparing a company’s current RPS to its past performance is important. A company that has consistently grown its RPS may be in a strong position, while a company with stagnant or declining RPS may face difficulties.
- Industry Norms: RPS can vary widely between industries. For example, tech companies might have high RPS due to rapid growth, while companies in more stable industries like utilities might have lower RPS.
- Growth Potential: A company with a lower RPS might still have strong growth potential, especially if it’s in the early stages of its business cycle. In contrast, a company with high RPS but stagnant growth may be facing challenges.
While Revenue Per Share (RPS) is a valuable financial metric, it does come with certain limitations that investors should be aware of when analyzing a company’s financial health. Understanding these limitations ensures that RPS is used in the right context and alongside other financial indicators for a more comprehensive analysis.
- Does Not Account for Profitability: RPS doesn’t tell investors whether a company is profitable. Two companies with similar RPS figures could have very different profit margins.
- Limited Insight into Cost Structure: RPS focuses only on revenue generation and doesn’t consider how efficiently a company controls its costs or manages its operational expenses.
- Influenced by Changes in Shares Outstanding: As mentioned earlier, changes in shares outstanding can affect RPS even if a company’s revenue remains stable. For example, if a company issues additional shares, its RPS may decrease, making it appear less efficient at generating revenue.
- Not Industry-Neutral: Revenue generation efficiency can vary greatly across industries. For instance, a technology company might have a higher RPS than a utility company, but that doesn’t necessarily mean it is performing better. Comparing RPS across different sectors can be misleading without considering industry-specific factors.
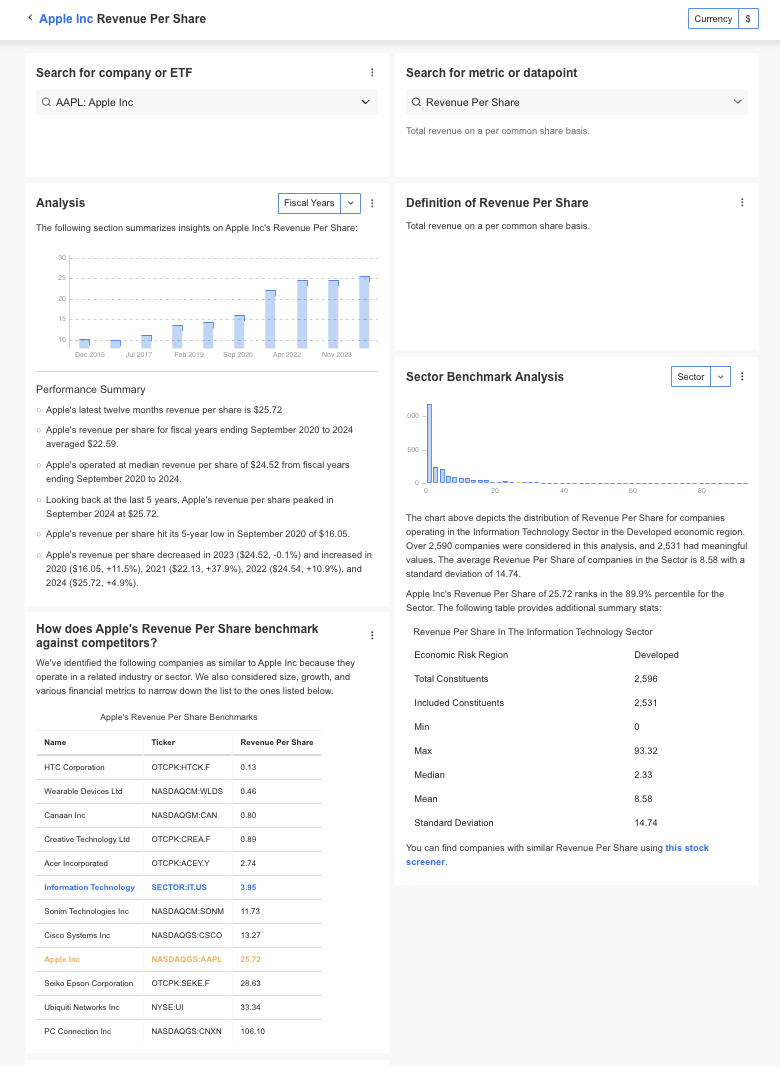
InvestingPro offers detailed insights into companies’ Revenue Per Share (RPS) including sector benchmarks and competitor analysis.
Unlock Premium Data With InvestingPro 📈💸
Gain instant access to Revenue Per Share data within the InvestingPro platform
🛠 Access to 1200+ additional fundamental metrics
🔍 Competitor comparison tools
📊 Evaluate stocks with 14+ proven financial models
No, Earnings Per Share (EPS) focuses on a company’s profitability (net income), while RPS focuses on revenue generation. EPS accounts for expenses, while RPS does not.
Can RPS be manipulated?
RPS is less prone to manipulation compared to other financial metrics, such as earnings. However, changes in shares outstanding (e.g., stock issuance) can affect RPS.
How often is RPS calculated?
RPS is typically calculated quarterly or annually, based on the company’s financial reports.
How can RPS help investors?
RPS provides insight into how efficiently a company is generating revenue per share. It’s useful for comparing companies and understanding revenue trends over time.
Can a company have high RPS and still face financial difficulties?
Yes, high RPS doesn’t guarantee profitability or financial stability. It’s important to assess other metrics, such as profit margins and cash flow.


