


What is Long-Term Debt to Equity Ratio?
The Long-Term Debt to Equity (LTDE) ratio is a financial metric that measures a company’s financial leverage by comparing its long-term debt to its shareholders’ equity. This ratio is important because it helps assess a company’s reliance on debt for financing long-term operations.
How to Calculate Long-Term Debt to Equity Ratio?
The Long-Term Debt to Equity (LTDE) ratio is calculated by dividing a company’s long-term debt by its shareholders’ equity. Long-term debt refers to financial obligations that are due in more than 12 months, while equity includes common stock, preferred stock, and retained earnings.
Its formula is:

LTDE Ratio = Long-Term Debt / Shareholders’ Equity
This ratio focuses only on long-term obligations, as opposed to the total debt ratio, which includes both short-term and long-term debt.

Where to Find LTDE Ratio Components?
Identify the long-term debt: This figure can be found on the company’s balance sheet, listed under non-current liabilities. Long-term debt refers to loans or bonds that mature in more than one year.
Determine the equity: Equity, or shareholders’ equity, can also be found on the balance sheet. It represents the owners’ claim on the company’s assets after all liabilities have been deducted. It includes common stock, preferred stock, and retained earnings.
Example Calculation of Long-Term Debt to Equity Ratio
Let’s say a company has the following financial information:
- Long-Term Debt: $500,000
- Total Equity: $1,000,000
Using the formula, the LTDE ratio calculation would be:
Long-Term Debt to Equity Ratio = Long-Term Debt / Shareholders’ (or Total) Equity
LTDE Ratio = 500,000 / 1,000,000 = 0.5
This means that the company has $0.50 of long-term debt for every dollar of equity. A ratio of 0.5 indicates that the company is using a relatively less or moderate amount of debt in relation to its equity, which means it’s not highly leveraged. This could suggest lower financial risk, which could in turn be seen as a sign of financial stability.
Why is Long-Term Debt to Equity Ratio Important?
This ratio offers insights into how much of the company’s financing comes from debt versus equity, helping investors and creditors evaluate the firm’s risk level and its ability to repay debt obligations over time. It helps investors assess how much risk a company might face if its earnings decline or interest rates rise, as companies with higher debt levels may struggle to meet obligations during difficult times.
By isolating long-term debt, the LTDE ratio provides a clearer picture of how a company plans to finance its growth and operations over a longer horizon, excluding the impact of immediate financial obligations.
Financial Leverage
The LTDE ratio indicates the proportion of debt versus equity in a company’s capital structure. A higher ratio suggests a company is more heavily reliant on debt, which could increase its financial risk. Companies with lower ratios typically use more equity financing, which could make them less risky to investors and lenders.
Risk Evaluation
A high LTDE ratio implies that the company is more leveraged, which means it must generate enough profits to cover its interest payments and debt repayments. If income falls, the company may struggle to meet these obligations. On the other hand, a lower ratio indicates that a company is using less debt and is therefore at a lower risk of insolvency under adverse economic conditions.
Industry Norms
It’s important to note that the ideal LTDE ratio can vary significantly across industries. For example, capital-intensive industries such as utilities or real estate often have higher LTDE ratios because they require substantial investment in infrastructure. Conversely, companies in technology or services may have lower ratios as their operational needs do not necessitate heavy borrowing.
Investor Perspective
Investors tend to prefer companies with lower LTDE ratios, as they are seen as less risky. A company with too much debt may face difficulties during periods of economic downturn or market volatility. Lenders, too, may be cautious about extending further credit to highly leveraged firms.
How to Interpret Long-Term Debt to Equity Ratio?
The LTDE ratio is typically expressed as a number, and the interpretation depends on its value:
- Ratio of 1.0: This indicates that a company’s long-term debt is equal to its equity. A company with a 1:1 ratio is considered to be equally financed by debt and equity.
- Ratio Below 1.0: A ratio less than 1.0 means the company has more equity than debt, which is generally seen as a sign of financial strength. Lower ratios are often viewed positively by investors since they suggest that the company may be better equipped to handle financial difficulties.
- Ratio Above 1.0: A ratio higher than 1.0 indicates that a company has more debt than equity. This suggests higher leverage and may raise concerns among investors about the company’s ability to manage its debt obligations, particularly if interest rates rise or if its income fluctuates.
Example:
If a company has $200 million in long-term debt and $100 million in equity, its LTDE ratio would be 2.0. This indicates the company is highly leveraged, with twice as much debt as equity. Investors and creditors may perceive this as a higher risk, especially if the company operates in an industry with unpredictable revenue streams.
What is a Good Long-Term Debt to Equity Ratio?
There is no one-size-fits-all answer for what constitutes a “good” LTDE ratio, as it depends on several factors, including the industry and the company’s financial strategy. However, here are some general guidelines:
- Below 1.0: A ratio below 1.0 is typically preferred, as it signals that a company is less reliant on debt and has a lower financial risk. It indicates that the company has a solid equity base to weather financial downturns.
- 1.0 to 2.0: This range suggests moderate leverage, where debt is used to finance the company’s operations but is still manageable. Companies in this range are often able to handle economic fluctuations better than those with higher ratios.
- Above 2.0: A ratio above 2.0 indicates significant reliance on debt. Such companies may be more vulnerable during economic downturns or periods of rising interest rates, as their debt servicing costs could become unsustainable.
Factors to Consider When Using the LTDE Ratio
While the LTDE ratio is useful for evaluating financial risk, it’s important to consider it in context. Here are a few factors to take into account:
- Industry Benchmarks: As mentioned, different industries have different norms for leverage. Comparing a company’s LTDE ratio with industry averages or its historical performance can provide a clearer picture of its financial health.
- Company Strategy: Some companies may intentionally maintain a higher LTDE ratio to finance expansion projects or take advantage of favorable borrowing conditions. This strategy can be effective if the company can generate sufficient returns on the capital invested.
- Economic Environment: Changes in interest rates, inflation, and overall economic conditions can impact a company’s ability to manage its long-term debt. A rising interest rate environment, for example, could increase debt servicing costs for highly leveraged companies.
How to Find Long-Term Debt to Equity Ratio?
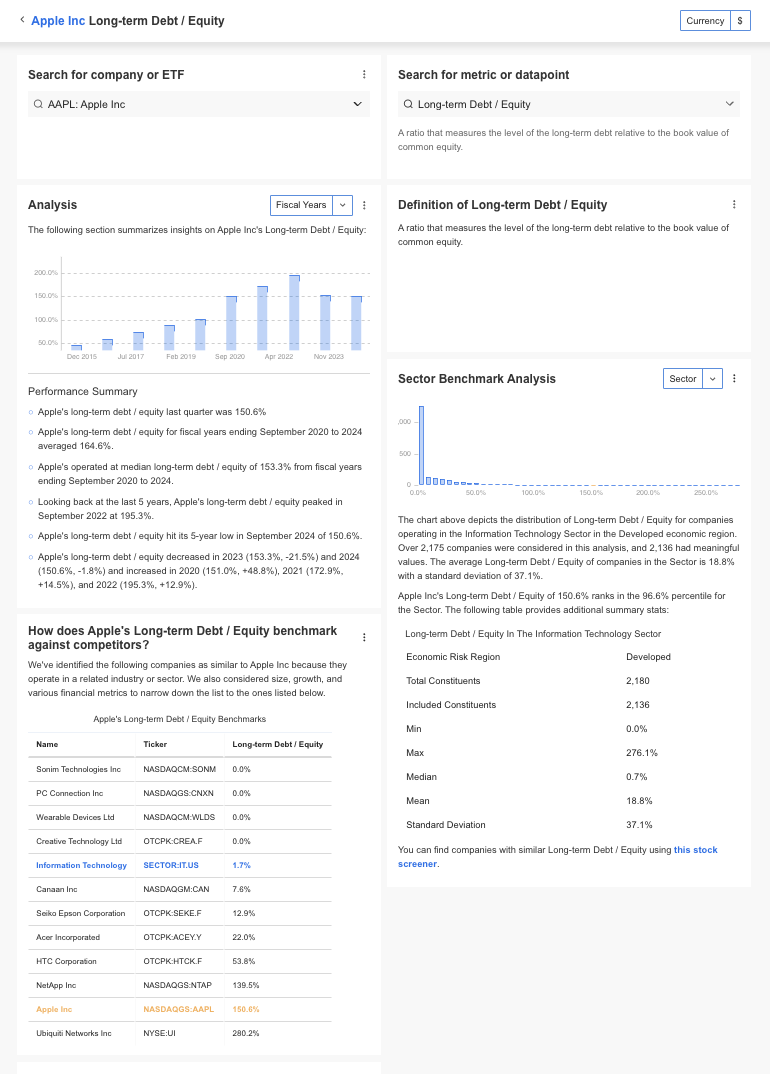
InvestingPro offers detailed insights into companies’ LTDE Ratio including sector benchmarks and competitor analysis.
InvestingPro: Access Long-Term Debt to Equity Ratio Data Instantly
Unlock Premium Data With InvestingPro 📈💸
Gain instant access to LTDE data within the InvestingPro platform
🛠 Access to 1200+ additional fundamental metrics
🔍 Competitor comparison tools
📊 Evaluate stocks with 14+ proven financial models
Long-Term Debt to Equity Ratio FAQ
What does a high Long-Term Debt to Equity ratio mean?
A high LTDE ratio means that a company is more reliant on debt to finance its operations, which increases its financial risk. It suggests that the company may struggle to meet its debt obligations if revenues decline.
How is the Long-Term Debt to Equity ratio different from the Debt to Equity ratio?
The main difference is that the LTDE ratio focuses only on long-term debt, while the debt-to-equity ratio includes both short-term and long-term debt. The LTDE ratio provides a clearer picture of a company’s long-term financial structure.
Can a company have a negative LTDE ratio?
No, a company cannot have a negative LTDE ratio, as both long-term debt and equity are positive values. However, if a company has negative equity (due to accumulated losses), it may indicate significant financial distress.


