


What is EV/Revenue?
The EV/Revenue multiple is a valuation ratio that measures the total value of a company (enterprise value) relative to its annual revenue. It indicates how much investors are willing to pay for each dollar of revenue generated by the company.
This metric is widely used in industries such as technology and startups, where companies may not yet be profitable but exhibit strong revenue growth. By focusing on revenue rather than earnings, the EV/Revenue multiple provides a more standardized way to compare companies at different stages of maturity.
How to Calculate EV/Revenue?
The formula for calculating the Enterprise Value/Revenue multiple is straightforward:
EV/Revenue = Enterprise Value / Revenue
Where:
- Enterprise Value (EV) = Market Capitalization + Total Debt – Cash and Cash Equivalents
- Revenue = Total revenue reported by the company over a specific period (usually 12 months).

Example Calculation of EV/Revenue
To illustrate how the EV/Revenue multiple is calculated, let’s examine a hypothetical company, ABC Corp., using real-world components of the formula.
Given Data for ABC Corp.:
- Market Capitalization: $10 billion
- Total Debt: $2 billion
- Cash and Cash Equivalents: $1 billion
- Total Revenue: $4 billion
Calculate Enterprise Value (EV)
The formula for Enterprise Value is:
EV = Market Capitalization + Total Debt – Cash and Cash Equivalents
EV = $10 billion + $2 billion – $1 billion
EV = $11 billion
The enterprise value of ABC Corp. is $11 billion.
Apply the EV/Revenue Formula
The EV/Revenue multiple is calculated as:
EV/Revenue = Enterprise Value / Annual Revenue
EV/Revenue = $11 billion / $4 billion
EV/Revenue = 2.75x
This result shows that investors are willing to pay $2.75 for every $1 of revenue generated by ABC Corp.
Interpretation of the Result
Industry Benchmarking
Suppose the average EV/Revenue multiple for ABC Corp.’s industry is 3.0x. With a multiple of 2.75x, ABC Corp. is valued slightly below its peers, suggesting the market might perceive lower growth potential, weaker margins, or higher risk for the company compared to competitors.
Growth Considerations
If ABC Corp. is a high-growth technology firm, a multiple of 2.75x might indicate that the company’s growth prospects are less robust than other firms in the sector, which typically command higher multiples (e.g., 5.0x or above). Conversely, if ABC Corp. operates in a mature industry like utilities, this multiple might signal a relatively high valuation, as such industries generally exhibit lower EV/Revenue multiples (e.g., 1.0x or less).
Why is the EV/Revenue Multiple Important?
The Enterprise Value-to-Revenue (EV/Revenue) multiple is a crucial metric for investors, analysts, and finance professionals when evaluating companies, particularly in industries with varying profit margins or high-growth potential. This valuation ratio compares a company’s enterprise value (EV) to its revenue, offering insights into market expectations and relative valuation. It is particularly favored in scenarios where profitability is limited or inconsistent.
Standardized Comparison
The EV/Revenue multiple allows analysts to compare companies across industries or within sectors without being skewed by varying profit margins or capital structures.
Focus on Growth
For companies in early stages of development or high-growth industries, revenue is often a more reliable metric than profitability, which may be limited or negative due to significant investments in growth.
Market Expectations
The multiple reflects the market’s perception of the company’s future growth potential, profitability, and risk profile. Higher multiples generally indicate higher growth expectations.
When is the EV/Revenue Multiple Used?
The EV/Revenue multiple is a versatile valuation metric that finds application in various financial and strategic scenarios. Its relevance stems from its focus on revenue rather than profitability, making it particularly useful in situations where earnings metrics like Price-to-Earnings (P/E) ratios fall short. Below are detailed examples of when the EV/Revenue multiple is used and why it is favored in these contexts.
- Valuation of High-Growth Companies: Startups and tech firms often prioritize revenue expansion over profitability, making this metric an ideal tool for valuation.
- Comparative Industry Analysis: Investors use the EV/Revenue multiple to benchmark companies against their peers within the same industry.
- Mergers and Acquisitions (M&A): In M&A transactions, this metric helps assess whether the target company’s valuation aligns with market expectations.
- Loss-Making Companies: When earnings metrics like Price-to-Earnings (P/E) are irrelevant due to negative net income, the EV/Revenue multiple offers a viable alternative.
Why the EV/Revenue Multiple Matters in These Scenarios
- Focus on Revenue Stability: Revenue is typically more stable and predictable than earnings, making it a reliable basis for valuation, especially in volatile or growth-focused sectors.
- Broad Applicability: The EV/Revenue multiple remains relevant even in cases where other valuation metrics, such as P/E or EV/EBITDA, fail to provide meaningful insights.
- Alignment with Market Expectations: This metric reflects the market’s perception of a company’s ability to grow and generate future profits, making it essential for assessing investor sentiment and strategic value.
By understanding when and how to use the EV/Revenue multiple, investors and analysts can gain a deeper appreciation of a company’s valuation and its position within the broader financial landscape.
How to Interpret the EV/Revenue Multiple
The EV/Revenue multiple represents the amount investors are willing to pay for each dollar of a company’s revenue.
- A higher EV/Revenue multiple indicates that the market expects stronger growth, better profitability, or unique competitive advantages.
- A lower EV/Revenue multiple might signal limited growth potential, weaker margins, or higher risks associated with the business.
The EV/Revenue multiple is highly context-dependent, meaning it varies widely across industries. Some sectors naturally command higher multiples due to higher growth rates, profitability, or less capital-intensive operations, while others have lower multiples due to their stable but slower-growing nature.
Examples:
- High Multiples: Technology, SaaS (Software-as-a-Service), and biotechnology companies often have EV/Revenue multiples above 10x because of high growth potential and scalability.
- Low Multiples: Manufacturing, utilities, and retail sectors usually exhibit EV/Revenue multiples between 1x and 3x due to slower growth and capital intensity.
Revenue growth is one of the most significant factors influencing the EV/Revenue multiple. Companies with higher growth rates often trade at higher multiples because investors expect their revenues to expand rapidly in the future.
Example Interpretation:
- A company with an EV/Revenue multiple of 5x and 30% annual revenue growth might be considered fairly valued.
- In contrast, a company with the same multiple but only 5% annual revenue growth might appear overvalued.
Factors Influencing the EV/Revenue Multiple
Several factors directly or indirectly influence the EV/Revenue ratio, ranging from internal company-specific metrics to broader industry and macroeconomic trends. Understanding these factors is essential for interpreting a company’s valuation in the context of its peers and market conditions.
Below, we explore the key factors that shape the EV/Revenue multiple, helping investors and analysts assess its implications more effectively.
- Growth Rate: Companies with higher revenue growth rates typically have higher EV/Revenue multiples, as investors expect future earnings potential.
- Industry Characteristics: The average multiple varies by industry, reflecting differing growth rates, risk levels, and capital requirements. For example, tech companies often command higher multiples than utility firms.
- Profit Margins: While the EV/Revenue multiple does not directly account for profitability, industries with high profit margins tend to have higher multiples because they convert revenue into profit more efficiently.
- Risk Profile: A higher perceived risk, such as economic volatility or company-specific challenges, can result in a lower EV/Revenue multiple.
Advantages and Limitations of the EV/Revenue Multiple
Advantages
- Simplicity: The metric is easy to calculate and widely understood, making it a popular choice for quick comparisons.
- Relevance for Non-Profitable Firms: It remains applicable even when earnings-based metrics fail due to negative net income.
- Neutrality: Unlike Price-to-Sales (P/S), the EV/Revenue multiple incorporates debt, offering a more comprehensive view of a company’s financial structure.
Limitations
- Ignores Profitability: The metric focuses solely on revenue and does not account for cost efficiency or profitability.
- Industry Dependency: Comparisons across industries may be misleading due to inherent differences in capital intensity and growth potential.
- Risk of Overvaluation: High multiples may indicate over-optimism, exposing investors to potential valuation corrections.
How to Find EV/Revenue?
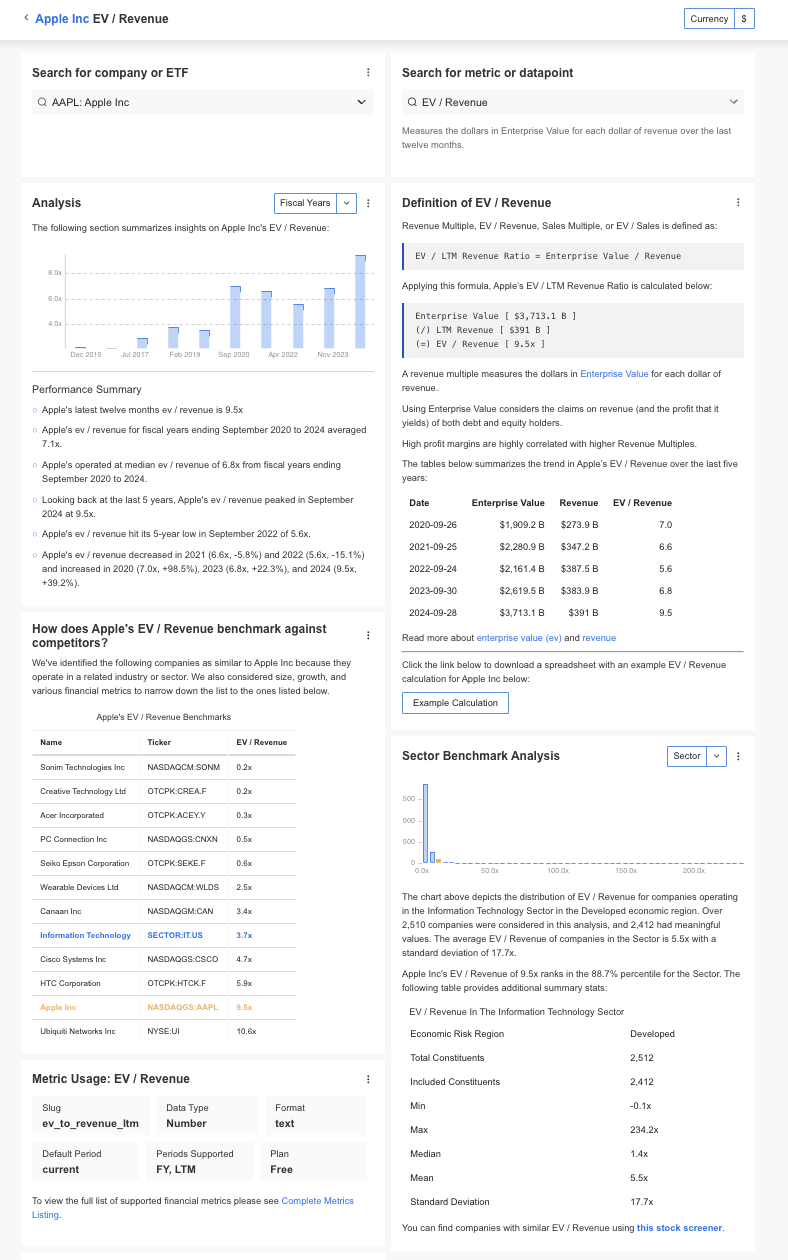
InvestingPro offers detailed insights into companies’ EV/Revenue including sector benchmarks and competitor analysis.
InvestingPro: Access EV/Revenue Data Instantly
Unlock Premium Data With InvestingPro 📈💸
Gain instant access to EV/Revenue data within the InvestingPro platform
🛠 Access to 1200+ additional fundamental metrics
🔍 Competitor comparison tools
📊 Evaluate stocks with 14+ proven financial models
EV/Revenue FAQ
How does the EV/Revenue multiple differ from the Price-to-Sales (P/S) ratio?
While both metrics measure valuation relative to revenue, the EV/Revenue multiple incorporates debt and cash, providing a more comprehensive view of a company’s capital structure.
What is a “good” EV/Revenue multiple?
The answer depends on the industry. For instance, tech firms often have higher multiples than manufacturing companies due to differing growth expectations and risk profiles.
Can the EV/Revenue multiple be negative?
No. Since enterprise value and revenue are inherently positive figures, the multiple cannot be negative.
Is the EV/Revenue multiple relevant for all industries?
The metric is most useful in industries where revenue growth is a key focus, such as technology, startups, and biotech. It may be less applicable to sectors with consistent earnings and stable margins, like utilities.


